Agency Dashboard
Your daily starting point. Requests, milestones, correspondence, monthly stats, team analytics, client analytics, and @mentions in one view.
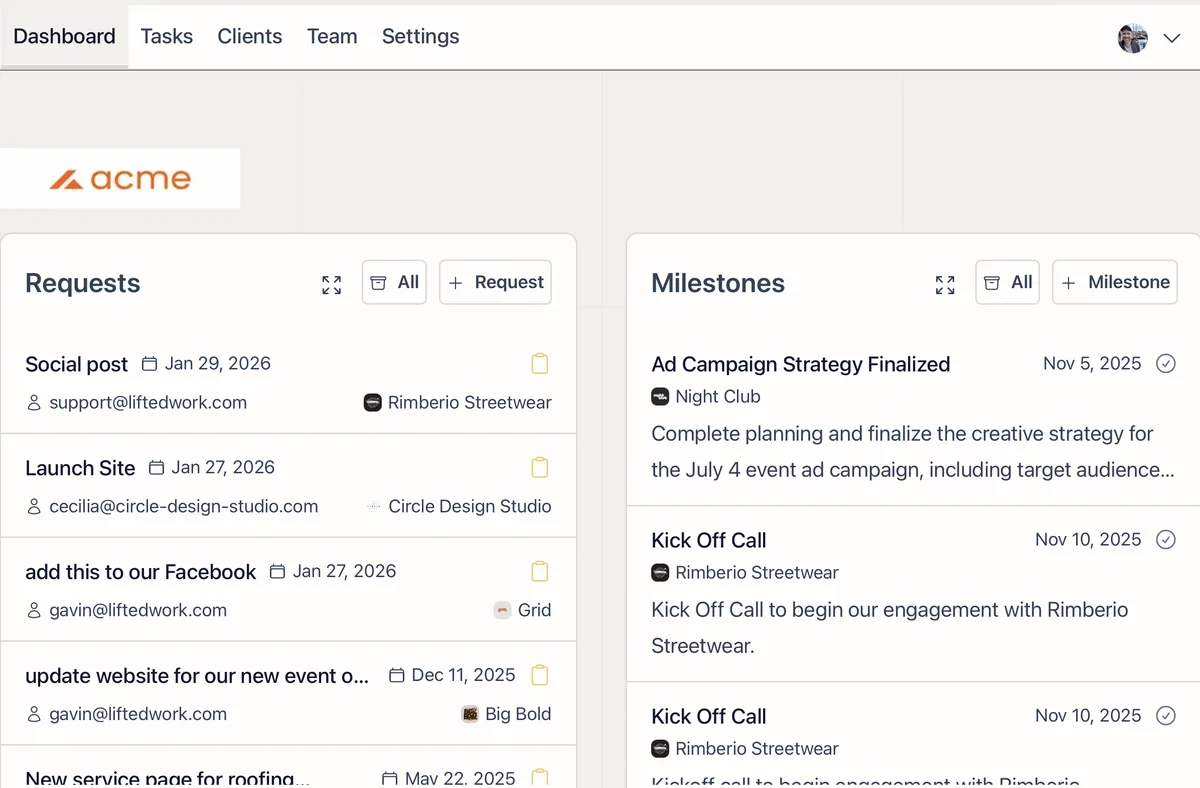
Start the Day Knowing Where Every Client Stands
The dashboard is your first screen each morning. The top row shows what is happening right now across every client. Below it, team and client analytics let you drill into the numbers by person or by client.
Requests
Incoming client requests with infinite scroll. Toggle between Upcoming (open requests) and All to see the full history. Create a new request directly from the panel.
Milestones
Upcoming and completed milestones across every client. Toggle between Incomplete and All. Create new milestones directly from the panel.
Correspondence
Your agency’s email threads and logged communications in one place. Toggle between a Summary view and the Full content of each thread. Correspondence syncs automatically if you connect Gmail, so every email between your team and your clients shows up here without manual entry. You can also log calls and meetings manually.
Monthly Stats
Navigate by month to see your agency’s numbers at a glance:
- Assigned hours and worked hours
- Completed, upcoming, and overdue tasks
- Won and lost clients (on plans with invoice tracking)
- Invoice totals (on plans with invoice tracking)
Team Analytics
Select any team member from the dropdown to see their individual stats for the month:
- Assigned and worked hours
- Completed, upcoming, and overdue tasks
- Time by Client breakdown showing hours worked vs. assigned per client
- Time by Task breakdown showing where their time went
This section also includes an @Mentions panel that surfaces unresolved mentions from tasks and chats, so you can see what still needs a response.
Client Analytics
Select a client from the dropdown to see their stats for the month:
- Assigned and worked hours
- Completed, upcoming, and overdue tasks
- Time by Person showing which team members worked on this client
- Time by Task showing hours per task
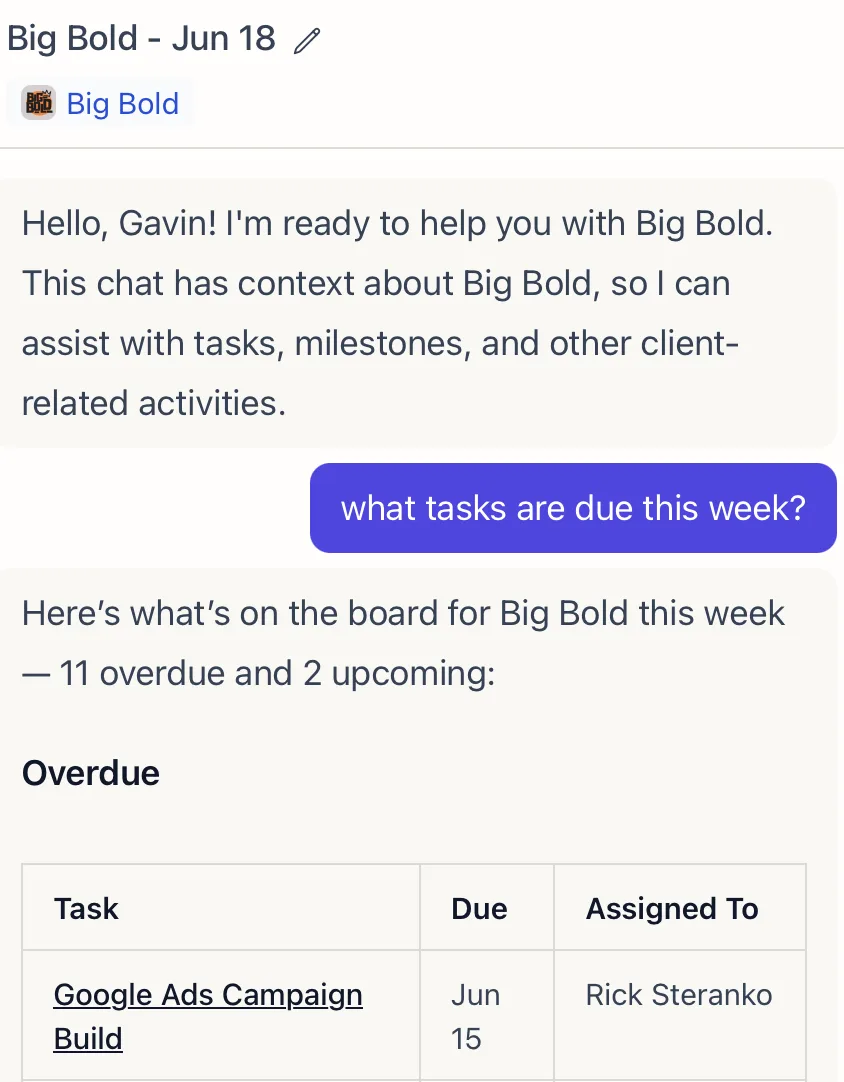
Ask Lifty for Reports
All of this data is available to the AI too. Open the Lifty sidebar and ask things like:
- “How many hours did we spend on @ClientName last month?”
- “Give me a summary of all completed tasks for @TeamMember this week”
- “Which clients are over budget this month?”
- “Summarize all incoming emails for @ClientName”
Lifty pulls from the same analytics, tasks, correspondence, and milestones that power the dashboard, so you can get a quick verbal summary without clicking through the panels yourself. The Lifty AI Sidebar how-to has more examples.
Correspondence: Email, Meetings, and More
Correspondence tracks emails, calls, meetings, and messages between your team and your clients.
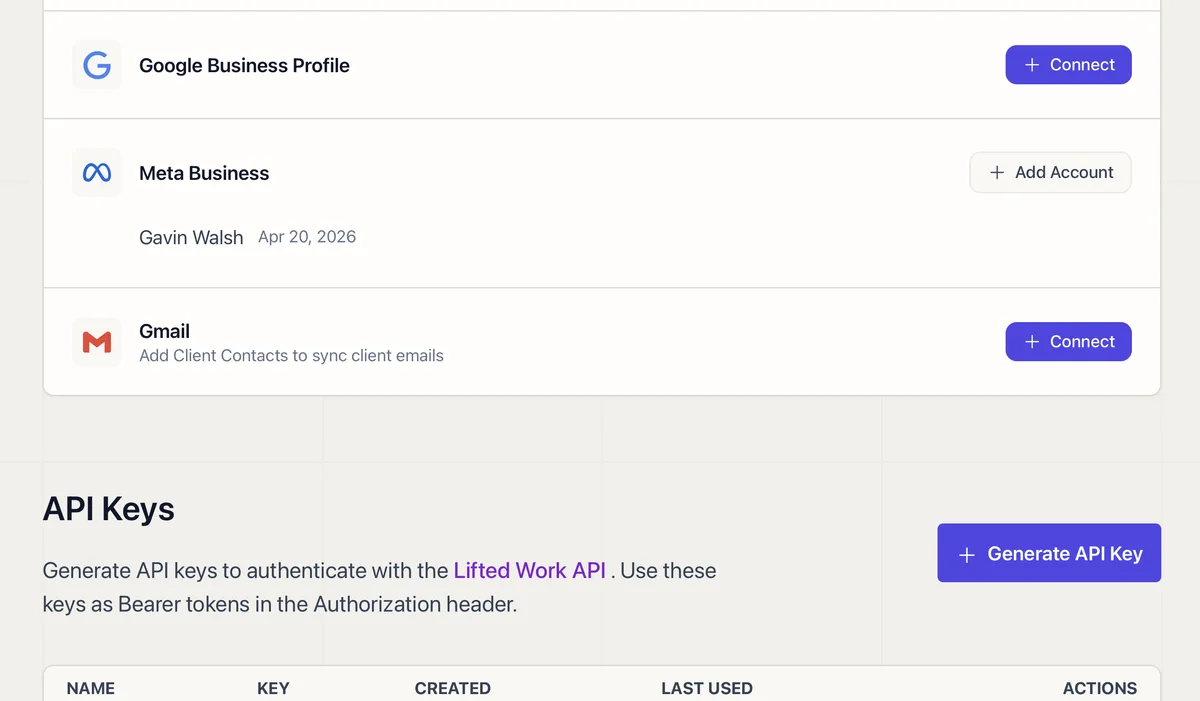
Gmail sync connects in Settings > Integrations and runs automatically. You can also pipe in data from other tools using Zapier integrations. Every email between your team and your clients is imported, including attachments. New emails come in through push notifications, so the dashboard stays current.
Zapier integration lets you pipe in correspondence from other tools. Sync video meeting transcripts from Fireflies, call logs from your phone system, or messages from any platform that connects to Zapier. Each one shows up as a correspondence entry tied to the right client.
You can also log calls and meetings manually from the dashboard. Each correspondence entry can be marked as resolved or unresolved, making it easy to track what still needs follow-up.
Related features
-
01
MCP Integration for Claude and ChatGPT
Connect Claude or ChatGPT to Lifted Work through MCP and manage tasks, clients, emails, reports, and analytics from any AI tool.
 02
02
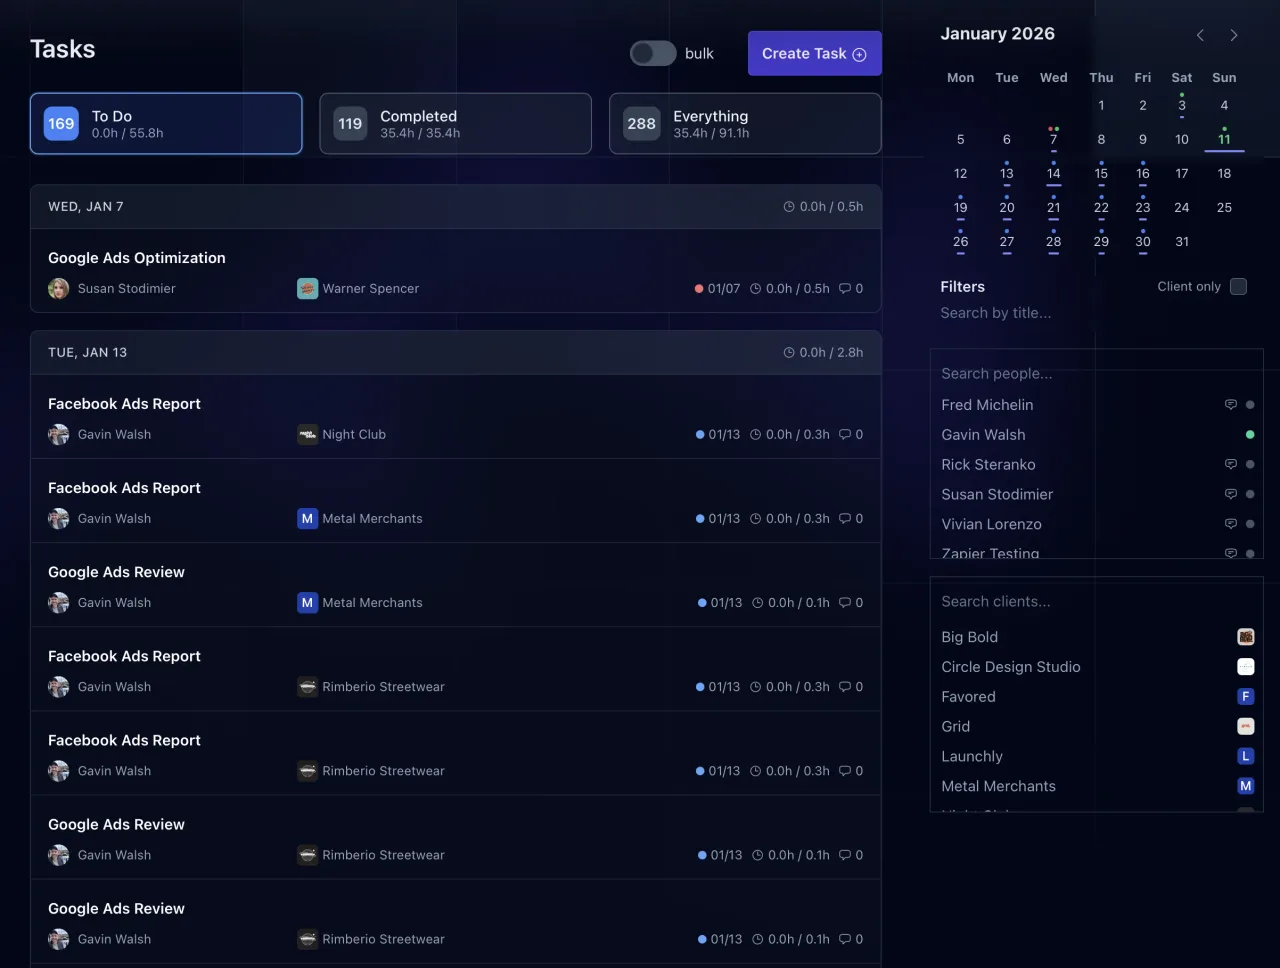
Task Management
Filter, sort, bulk-update, and schedule tasks across every client from one place.
 03
03
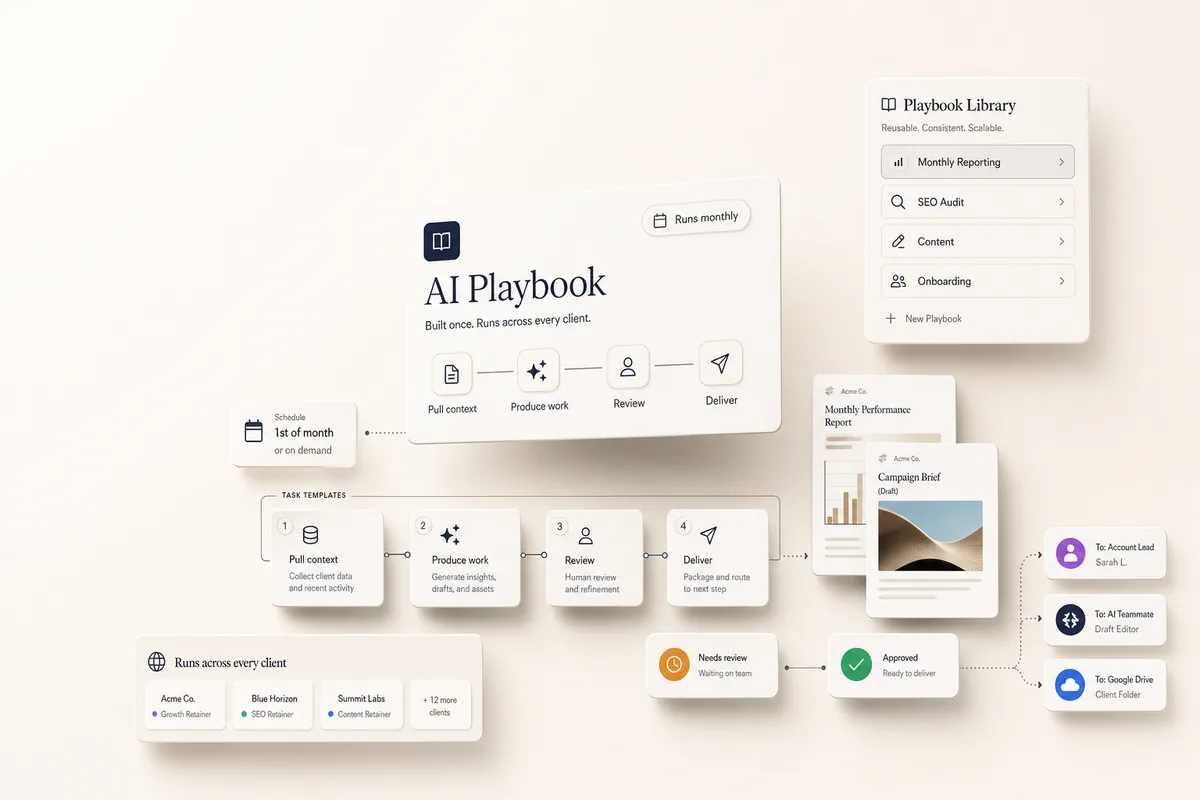
AI Playbooks
Turn a recurring process into a playbook that runs on a schedule, produces real deliverables, and routes them through your team before they reach a client.
 04
04
Lifty AI
An AI assistant that already knows your clients: their brand, work, emails, analytics, and history. Ask it to summarize, draft, report, or build the next task.