Table of contents
Account Health Report Template for Internal Reviews
An internal report template for account managers covering task performance, time tracking, client requests, correspondence, and team workload over the last 30 days.
What this is
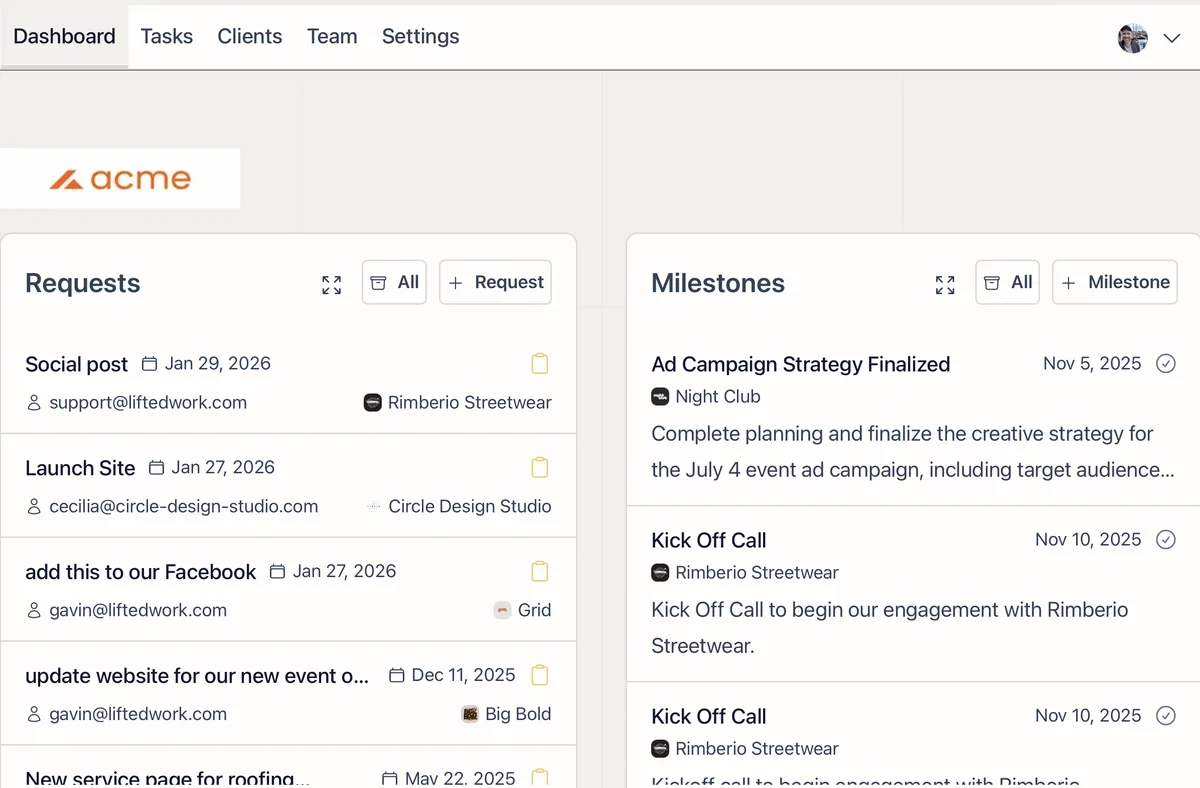
An internal report template for account managers. It pulls the last 30 days of activity for a client and summarizes it into a single document: what was requested, what got done, how long it took, what’s still open, and anything that needs attention. This is not a client-facing report. It’s for your team to review account health at a glance.
The AI pulls tasks, requests, correspondence, and milestones, then fills in the template. You get a finished PDF or HTML report.
What it covers
- Task performance with completion rates, overdue counts, and time tracking (actual vs budgeted hours)
- Team workload showing who worked on the client, how many tasks they handled, and hours spent
- Client requests with open, closed, and outstanding breakdowns
- Communication activity covering emails, meetings, and calls
- Flagged items from tasks that had comments or discussion, surfacing potential issues
- Milestones with upcoming and completed status
- Recommendations for what to focus on next
Before you start
This template works with data already inside Lifted Work. No external integrations are required. The AI pulls from:
- Tasks for completion counts, time tracking, who worked on what, and comment threads
- Requests for what the client has asked for and whether it’s been handled
- Correspondence for logged emails, meetings, and calls
- Milestones for project timeline tracking
If you track time on tasks (budgeted and actual minutes), the utilization metrics will be populated. If you don’t track time, those sections will still render but show zeros.
Step 1: Create the report template
Go to the client’s overview, open the Report Templates section, and click New. Give it a name like “Account Health Report” and set the output to PDF (or HTML if you prefer a web link).
Step 2: Paste the head section
Copy the block below into the Head HTML field. This loads the Inter and JetBrains Mono fonts and includes the number animation script and styling.
<link rel="preconnect" href="https://fonts.googleapis.com">
<link rel="preconnect" href="https://fonts.gstatic.com" crossorigin>
<link href="https://fonts.googleapis.com/css2?family=Inter:wght@400;500;600;700&family=JetBrains+Mono:wght@400;500&display=swap" rel="stylesheet">
<style>
  body {
    font-family: 'Inter', system-ui, -apple-system, sans-serif;
    color: #1c1917;
    background: #ffffff;
    margin: 0;
    padding: 0;
  }
  .font-mono { font-family: 'JetBrains Mono', monospace; }

  .metric-card {
    background: #fafaf9;
    border: 1px solid #e7e5e4;
    border-radius: 12px;
    padding: 20px 24px;
  }
  .metric-label {
    font-size: 11px;
    font-weight: 600;
    letter-spacing: 0.05em;
    text-transform: uppercase;
    color: #78716c;
    margin-bottom: 8px;
  }
  .metric-value {
    font-family: 'JetBrains Mono', monospace;
    font-size: 32px;
    font-weight: 500;
    color: #1c1917;
    line-height: 1;
  }
  .metric-detail {
    font-size: 13px;
    color: #a8a29e;
    margin-top: 8px;
  }

  .status-healthy { background: #ecfdf5; color: #059669; border: 1px solid #a7f3d0; }
  .status-attention { background: #fffbeb; color: #d97706; border: 1px solid #fde68a; }
  .status-at-risk { background: #fef2f2; color: #dc2626; border: 1px solid #fecaca; }

  .section-icon {
    width: 24px;
    height: 24px;
    display: inline-flex;
    align-items: center;
    justify-content: center;
    border-radius: 6px;
    font-size: 14px;
    margin-right: 10px;
  }

  table {
    width: 100%;
    border-collapse: collapse;
    font-size: 13px;
  }
  th {
    text-align: left;
    font-weight: 600;
    font-size: 11px;
    text-transform: uppercase;
    letter-spacing: 0.05em;
    color: #78716c;
    padding: 10px 12px;
    border-bottom: 2px solid #e7e5e4;
  }
  td {
    padding: 10px 12px;
    border-bottom: 1px solid #f5f5f4;
    color: #44403c;
    vertical-align: top;
  }
  tr:last-child td { border-bottom: none; }

  .tag {
    display: inline-block;
    padding: 2px 8px;
    border-radius: 4px;
    font-size: 11px;
    font-weight: 500;
  }
  .tag-open { background: #dbeafe; color: #1d4ed8; }
  .tag-closed { background: #f3f4f6; color: #6b7280; }
  .tag-overdue { background: #fef2f2; color: #dc2626; }
  .tag-completed { background: #ecfdf5; color: #059669; }

  @media print {
    body { -webkit-print-color-adjust: exact; print-color-adjust: exact; }
    .page-break { break-after: page; }
    .no-break { break-inside: avoid; }
  }
</style>
<script>
  function parseNumber(text) {
    if (!text) return null;
    const cleaned = text.replace(/[^0-9.\-]/g, '');
    const num = parseFloat(cleaned);
    return isNaN(num) ? null : num;
  }
  function formatNumber(num, original) {
    const hasPercent = original.includes('%');
    const hasDecimal = original.includes('.');
    const decimals = hasDecimal ? (original.split('.')[1] || '').replace(/[^0-9]/g, '').length : 0;
    let formatted = num.toFixed(decimals).replace(/\B(?=(\d{3})+(?!\d))/g, ',');
    if (hasPercent) formatted += '%';
    return formatted;
  }
  function animateValue(el) {
    const original = el.textContent;
    const target = parseNumber(original);
    if (target === null) return;
    const duration = 1200;
    const start = performance.now();
    function update(now) {
      const elapsed = now - start;
      const progress = Math.min(elapsed / duration, 1);
      const eased = 1 - Math.pow(1 - progress, 3);
      el.textContent = formatNumber(target * eased, original);
      if (progress < 1) requestAnimationFrame(update);
    }
    requestAnimationFrame(update);
  }
  document.addEventListener('DOMContentLoaded', function() {
    const observer = new IntersectionObserver(function(entries) {
      entries.forEach(function(entry) {
        if (entry.isIntersecting) {
          animateValue(entry.target);
          observer.unobserve(entry.target);
        }
      });
    }, { threshold: 0.3 });
    document.querySelectorAll('[data-animate-number]').forEach(function(el) {
      observer.observe(el);
    });
  });
</script>
Step 3: Paste the body section
Copy the block below into the Body HTML field. Every section is wrapped in a conditional, so sections with no data are hidden automatically.
<div class="max-w-4xl mx-auto px-8 py-12">
<!-- HEADER -->
<div class="mb-10">
<div class="flex items-start justify-between">
<div>
<p class="text-xs font-semibold tracking-widest uppercase text-stone-400 mb-1">{{ report_title | default: "Account Health Report" }}</p>
<h1 class="text-3xl font-bold text-stone-900 mb-1">{{ client_name }}</h1>
<p class="text-base text-stone-500">{{ report_period | default: "Last 30 Days" }}</p>
</div>
<div class="text-right">
{% if client_logo %}
<img src="{{ client_logo }}" alt="{{ client_name }}" class="h-10 mb-2 ml-auto" />
{% endif %}
<p class="text-sm text-stone-500">{{ agency_name }}</p>
{% if account_manager %}
<p class="text-xs text-stone-400">Account Manager: {{ account_manager }}</p>
{% endif %}
</div>
</div>
{% if health_status %}
<div class="mt-6 inline-flex items-center gap-2 px-4 py-2 rounded-lg text-sm font-semibold
{% if health_status == 'On Track' %}status-healthy{% endif %}
{% if health_status == 'Needs Attention' %}status-attention{% endif %}
{% if health_status == 'At Risk' %}status-at-risk{% endif %}
">
{% if health_status == 'On Track' %}●{% endif %}
{% if health_status == 'Needs Attention' %}▲{% endif %}
{% if health_status == 'At Risk' %}⚠{% endif %}
{{ health_status }}
</div>
{% endif %}
</div>
<!-- EXECUTIVE SUMMARY -->
{% if executive_summary %}
<div class="mb-10 bg-stone-50 border border-stone-200 rounded-xl p-6 no-break">
<p class="text-xs font-semibold tracking-widest uppercase text-stone-400 mb-3">Executive Summary</p>
<p class="text-sm text-stone-700 leading-relaxed">{{ executive_summary }}</p>
</div>
{% endif %}
<!-- TASK PERFORMANCE -->
<div class="mb-10">
<div class="flex items-center mb-6">
<span class="section-icon bg-blue-50 text-blue-600">☑</span>
<h2 class="text-lg font-bold text-stone-900">Task Performance</h2>
</div>
<div class="grid grid-cols-3 gap-4 mb-6">
<div class="metric-card">
<div class="metric-label">Total Tasks</div>
<div class="metric-value" data-animate-number>{{ total_tasks | default: "0" }}</div>
<div class="metric-detail">in period</div>
</div>
<div class="metric-card">
<div class="metric-label">Completed</div>
<div class="metric-value" data-animate-number>{{ completed_tasks | default: "0" }}</div>
{% if completion_rate %}
<div class="metric-detail">{{ completion_rate }} completion rate</div>
{% endif %}
</div>
<div class="metric-card">
<div class="metric-label">Overdue</div>
<div class="metric-value" data-animate-number>{{ overdue_tasks | default: "0" }}</div>
<div class="metric-detail">past due date</div>
</div>
</div>
<div class="grid grid-cols-3 gap-4 mb-6">
<div class="metric-card">
<div class="metric-label">Hours Spent</div>
<div class="metric-value" data-animate-number>{{ hours_spent | default: "0" }}</div>
<div class="metric-detail">actual hours logged</div>
</div>
<div class="metric-card">
<div class="metric-label">Hours Budgeted</div>
<div class="metric-value" data-animate-number>{{ hours_budgeted | default: "0" }}</div>
<div class="metric-detail">estimated hours</div>
</div>
<div class="metric-card">
<div class="metric-label">Utilization</div>
<div class="metric-value" data-animate-number>{{ utilization_rate | default: "0%" }}</div>
<div class="metric-detail">actual vs budgeted</div>
</div>
</div>
</div>
<!-- OUTSTANDING TASKS -->
{% if outstanding_tasks.size > 0 %}
<div class="mb-10 no-break">
<h3 class="text-sm font-bold text-stone-700 uppercase tracking-wide mb-3">Outstanding Tasks</h3>
<div class="border border-stone-200 rounded-xl overflow-hidden">
<table>
<thead>
<tr class="bg-stone-50">
<th>Task</th>
<th>Assigned To</th>
<th>Due</th>
<th>Budgeted</th>
<th>Status</th>
</tr>
</thead>
<tbody>
{% for task in outstanding_tasks %}
<tr>
<td class="font-medium text-stone-900">{{ task.title }}</td>
<td>{{ task.assigned_to }}</td>
<td class="font-mono text-xs">{{ task.due_at }}</td>
<td class="font-mono text-xs">{{ task.budgeted_hours }}</td>
<td>
{% if task.overdue %}
<span class="tag tag-overdue">Overdue</span>
{% else %}
<span class="tag tag-open">{{ task.status }}</span>
{% endif %}
</td>
</tr>
{% endfor %}
</tbody>
</table>
</div>
</div>
{% endif %}
<!-- COMPLETED TASKS -->
{% if completed_task_list.size > 0 %}
<div class="mb-10 page-break no-break">
<h3 class="text-sm font-bold text-stone-700 uppercase tracking-wide mb-3">Completed Tasks</h3>
<div class="border border-stone-200 rounded-xl overflow-hidden">
<table>
<thead>
<tr class="bg-stone-50">
<th>Task</th>
<th>Completed By</th>
<th>Date</th>
<th>Hours</th>
</tr>
</thead>
<tbody>
{% for task in completed_task_list %}
<tr>
<td class="font-medium text-stone-900">{{ task.title }}</td>
<td>{{ task.assigned_to }}</td>
<td class="font-mono text-xs">{{ task.completed_at }}</td>
<td class="font-mono text-xs">{{ task.hours_spent }}</td>
</tr>
{% endfor %}
</tbody>
</table>
</div>
</div>
{% endif %}
<!-- TEAM WORKLOAD -->
{% if team_members.size > 0 %}
<div class="mb-10 no-break">
<div class="flex items-center mb-6">
<span class="section-icon bg-violet-50 text-violet-600">👥</span>
<h2 class="text-lg font-bold text-stone-900">Team Workload</h2>
</div>
<div class="border border-stone-200 rounded-xl overflow-hidden">
<table>
<thead>
<tr class="bg-stone-50">
<th>Team Member</th>
<th>Tasks Completed</th>
<th>Tasks In Progress</th>
<th>Hours Spent</th>
<th>Hours Budgeted</th>
</tr>
</thead>
<tbody>
{% for member in team_members %}
<tr>
<td class="font-medium text-stone-900">{{ member.name }}</td>
<td class="font-mono" data-animate-number>{{ member.tasks_completed }}</td>
<td class="font-mono" data-animate-number>{{ member.tasks_in_progress }}</td>
<td class="font-mono">{{ member.hours_spent }}</td>
<td class="font-mono">{{ member.hours_budgeted }}</td>
</tr>
{% endfor %}
</tbody>
</table>
</div>
</div>
{% endif %}
<!-- CLIENT REQUESTS -->
<div class="mb-10">
<div class="flex items-center mb-6">
<span class="section-icon bg-amber-50 text-amber-600">💬</span>
<h2 class="text-lg font-bold text-stone-900">Client Requests</h2>
</div>
<div class="grid grid-cols-3 gap-4 mb-6">
<div class="metric-card">
<div class="metric-label">Total Requests</div>
<div class="metric-value" data-animate-number>{{ total_requests | default: "0" }}</div>
<div class="metric-detail">in period</div>
</div>
<div class="metric-card">
<div class="metric-label">Open</div>
<div class="metric-value" data-animate-number>{{ open_requests | default: "0" }}</div>
<div class="metric-detail">still active</div>
</div>
<div class="metric-card">
<div class="metric-label">Closed</div>
<div class="metric-value" data-animate-number>{{ closed_requests | default: "0" }}</div>
<div class="metric-detail">resolved</div>
</div>
</div>
{% if open_request_list.size > 0 %}
<div class="mb-4 no-break">
<h3 class="text-sm font-bold text-stone-700 uppercase tracking-wide mb-3">Open Requests</h3>
<div class="border border-stone-200 rounded-xl overflow-hidden">
<table>
<thead>
<tr class="bg-stone-50">
<th>Request</th>
<th>Submitted By</th>
<th>Date</th>
<th>Details</th>
</tr>
</thead>
<tbody>
{% for req in open_request_list %}
<tr>
<td class="font-medium text-stone-900">{{ req.title }}</td>
<td>{{ req.created_by }}</td>
<td class="font-mono text-xs">{{ req.created_at }}</td>
<td class="text-xs text-stone-500">{{ req.details }}</td>
</tr>
{% endfor %}
</tbody>
</table>
</div>
</div>
{% endif %}
</div>
<!-- COMMUNICATION SUMMARY -->
{% if total_correspondences %}
<div class="mb-10">
<div class="flex items-center mb-6">
<span class="section-icon bg-teal-50 text-teal-600">✉</span>
<h2 class="text-lg font-bold text-stone-900">Communication Activity</h2>
</div>
<div class="grid grid-cols-3 gap-4 mb-6">
<div class="metric-card">
<div class="metric-label">Emails</div>
<div class="metric-value" data-animate-number>{{ emails_count | default: "0" }}</div>
</div>
<div class="metric-card">
<div class="metric-label">Meetings</div>
<div class="metric-value" data-animate-number>{{ meetings_count | default: "0" }}</div>
</div>
<div class="metric-card">
<div class="metric-label">Calls</div>
<div class="metric-value" data-animate-number>{{ calls_count | default: "0" }}</div>
</div>
</div>
{% if recent_correspondence.size > 0 %}
<div class="no-break">
<h3 class="text-sm font-bold text-stone-700 uppercase tracking-wide mb-3">Recent Activity</h3>
<div class="border border-stone-200 rounded-xl overflow-hidden">
<table>
<thead>
<tr class="bg-stone-50">
<th>Type</th>
<th>Topic</th>
<th>Date</th>
<th>Participants</th>
</tr>
</thead>
<tbody>
{% for item in recent_correspondence %}
<tr>
<td>
<span class="tag {% if item.type == 'email' %}bg-blue-50 text-blue-700{% elsif item.type == 'meeting' %}bg-purple-50 text-purple-700{% else %}bg-green-50 text-green-700{% endif %}">{{ item.type }}</span>
</td>
<td class="font-medium text-stone-900">{{ item.topic }}</td>
<td class="font-mono text-xs">{{ item.date }}</td>
<td class="text-xs text-stone-500">{{ item.participants }}</td>
</tr>
{% endfor %}
</tbody>
</table>
</div>
</div>
{% endif %}
</div>
{% endif %}
<!-- FLAGGED ITEMS / ISSUES -->
{% if flagged_tasks.size > 0 %}
<div class="mb-10 page-break">
<div class="flex items-center mb-6">
<span class="section-icon bg-red-50 text-red-600">⚠</span>
<h2 class="text-lg font-bold text-stone-900">Flagged Items</h2>
</div>
<p class="text-sm text-stone-500 mb-4">Tasks with active discussion or comments that may need attention.</p>
<div class="space-y-3">
{% for task in flagged_tasks %}
<div class="border border-stone-200 rounded-xl p-4 no-break">
<div class="flex items-start justify-between mb-2">
<p class="font-medium text-stone-900 text-sm">{{ task.title }}</p>
<span class="text-xs text-stone-400">{{ task.assigned_to }}</span>
</div>
{% if task.latest_comment %}
<p class="text-xs text-stone-500 bg-stone-50 rounded-lg p-3 italic">"{{ task.latest_comment }}"</p>
{% endif %}
</div>
{% endfor %}
</div>
</div>
{% endif %}
<!-- MILESTONES -->
{% if milestones.size > 0 %}
<div class="mb-10 no-break">
<div class="flex items-center mb-6">
<span class="section-icon bg-indigo-50 text-indigo-600">⚑</span>
<h2 class="text-lg font-bold text-stone-900">Milestones</h2>
</div>
<div class="border border-stone-200 rounded-xl overflow-hidden">
<table>
<thead>
<tr class="bg-stone-50">
<th>Milestone</th>
<th>Date</th>
<th>Status</th>
</tr>
</thead>
<tbody>
{% for ms in milestones %}
<tr>
<td class="font-medium text-stone-900">{{ ms.title }}</td>
<td class="font-mono text-xs">{{ ms.date }}</td>
<td>
{% if ms.completed %}
<span class="tag tag-completed">Complete</span>
{% else %}
<span class="tag tag-open">Upcoming</span>
{% endif %}
</td>
</tr>
{% endfor %}
</tbody>
</table>
</div>
</div>
{% endif %}
<!-- KEY ISSUES -->
{% if key_issues.size > 0 %}
<div class="mb-6 no-break">
<h3 class="text-sm font-bold text-stone-700 uppercase tracking-wide mb-3">Key Issues</h3>
<ul class="space-y-2">
{% for issue in key_issues %}
<li class="flex items-start gap-2 text-sm text-stone-700">
<span class="text-red-400 mt-0.5">●</span>
<span>{{ issue }}</span>
</li>
{% endfor %}
</ul>
</div>
{% endif %}
<!-- RECOMMENDATIONS -->
{% if recommendations.size > 0 %}
<div class="mb-10 no-break">
<h3 class="text-sm font-bold text-stone-700 uppercase tracking-wide mb-3">Recommendations</h3>
<ol class="space-y-2 list-decimal list-inside">
{% for rec in recommendations %}
<li class="text-sm text-stone-700">{{ rec }}</li>
{% endfor %}
</ol>
</div>
{% endif %}
<!-- FOOTER -->
<div class="mt-16 pt-6 border-t border-stone-200 flex justify-between items-center text-xs text-stone-400">
<span>{{ agency_name }} · {{ current_date }}</span>
<span>Confidential · Internal Use Only</span>
</div>
</div>Step 4: Render the report
You can render the report two ways.
Manually via the AI chat: Open a task for the client, open the AI chat sidebar, and tell Lifty:
Generate the Account Health Report for the last 30 days using all the template variables.
That works if the AI can figure out the variable mapping from the template. If you want more reliable results, use the detailed prompt below. It tells the AI exactly which tools to call, what fields to request, and how to build every template variable:
Run the Account Health Report template for this client for the last 30 days. Here is how to gather and transform the data:
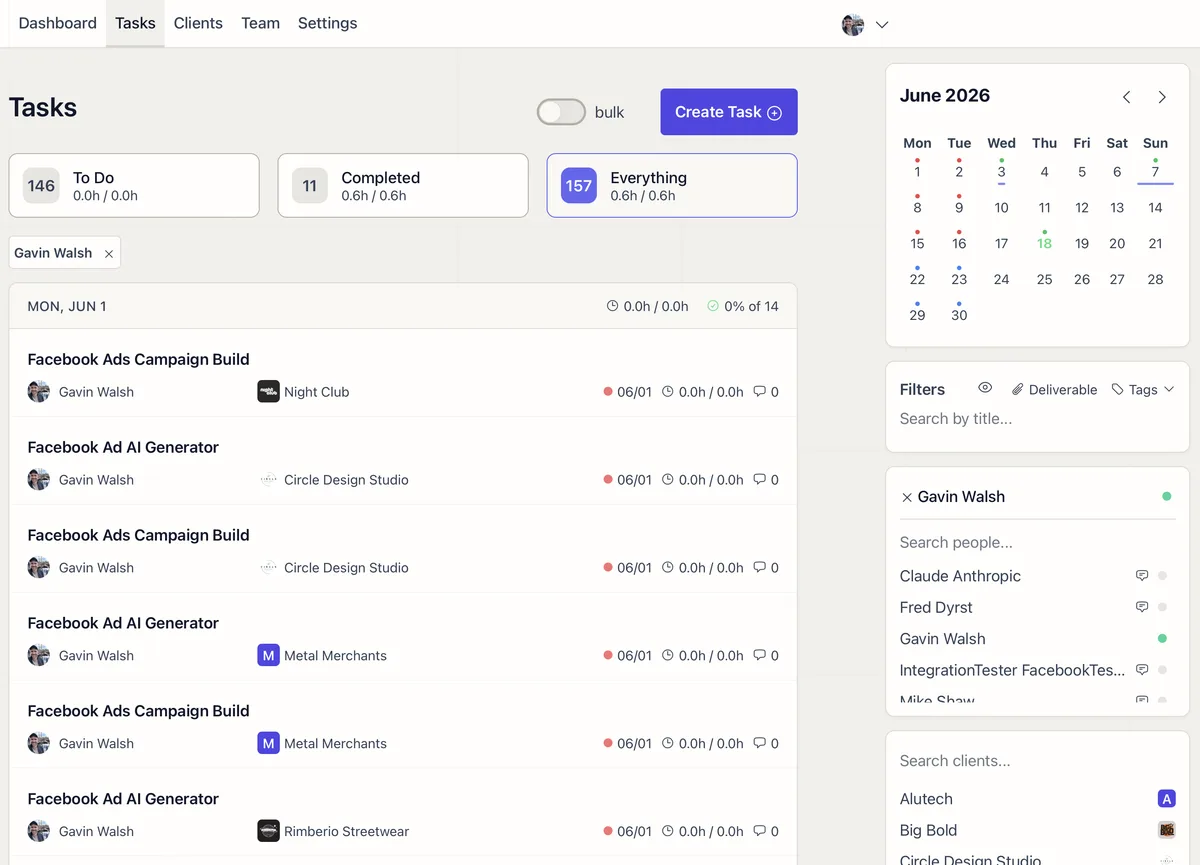
Get all tasks for this client from the last 30 days. Include comments, time spent, time budgeted, and completion dates. Use a single call with status “Everything” so you get completed, in-progress, and overdue tasks together.
Count how many tasks are completed, how many are overdue, and how many total. Compute the completion rate as a percentage like “75%”.
Add up the actual time spent across all completed tasks and convert to hours. Do the same for budgeted time. Compute the utilization rate as a percentage (time spent divided by time budgeted). If nothing was budgeted, set utilization to “N/A”.
Build the completed task list. For each completed task, include the title, who it was assigned to (just the person’s name), the date it was completed formatted like “May 2”, and how many hours were spent.
Build the outstanding task list from tasks that aren’t completed or closed. For each, include the title, who it’s assigned to, when it’s due, how many hours are budgeted (with an “h” suffix like “1.5h”), the status, and whether it’s overdue.
Build the team workload list by grouping all tasks by who they’re assigned to. For each person, count how many tasks they completed, how many are still in progress, and total up their hours spent and hours budgeted.
Build the flagged tasks list from any tasks that have comments. For each, include the title, who it’s assigned to, and the text of the most recent comment.
Get all requests for this client from the same period. Count how many are open, closed, and total. Build the open requests list with the title, who submitted it, when it was created (formatted like “May 2”), and the details.
Get all correspondence for this client from the same period, including participants. Count how many are emails, meetings, and calls. Build the recent correspondence list with the type, topic, date (formatted like “May 2”), and participants as a comma-separated list of just names (drop the role labels in parentheses).
Get milestones for this client from the same period. Include the title, date, and whether each one is completed.
Set the health status. “On Track” if completion rate is above 80% and nothing is overdue. “Needs Attention” if there are overdue tasks or completion rate is between 50-80%. “At Risk” if completion rate is below 50% or more than 3 tasks are overdue.
Write a 2-3 sentence executive summary covering completion rate, hours, open requests, and any concerns. Write a list of key issues found in the data. Write a list of concrete recommendations for next steps. Set the report period and account manager name.
Render the template as PDF with all these variables.
Automatically via a scheduled task: Create a task template with the detailed prompt above, set it as the Lifty Prompt with Run on complete enabled, turn on Autocomplete, and schedule it for the first business day of each month. See the AI Task Scheduling guide for the full setup.
Under Tools for AI on the task, select: list_tasks, list_requests, list_correspondences, list_milestones, report_templates, reports.
How the variables work
The template uses Liquid syntax. Variables wrapped in {{ }} get replaced with real values when the report is rendered. Variables inside {% if %} blocks are conditional. If the AI doesn’t provide that variable, the section is hidden.
There are two types of variables:
System variables are filled in automatically. You never need to provide these:
client_nameandclient_logo(from the client record)agency_name(from your agency record)current_dateandcurrent_month(set at render time)
Custom variables are provided by the AI when it renders the report. The AI calls the tools, transforms the raw data, and passes pre-computed values. Here’s what each variable expects:
| Variable | What the AI fills in |
|---|---|
report_title | e.g. “Account Health Report” |
report_period | e.g. “April 11 - May 11, 2026” |
account_manager | Name of the account manager for this client |
health_status | Exactly one of: “On Track”, “Needs Attention”, or “At Risk” |
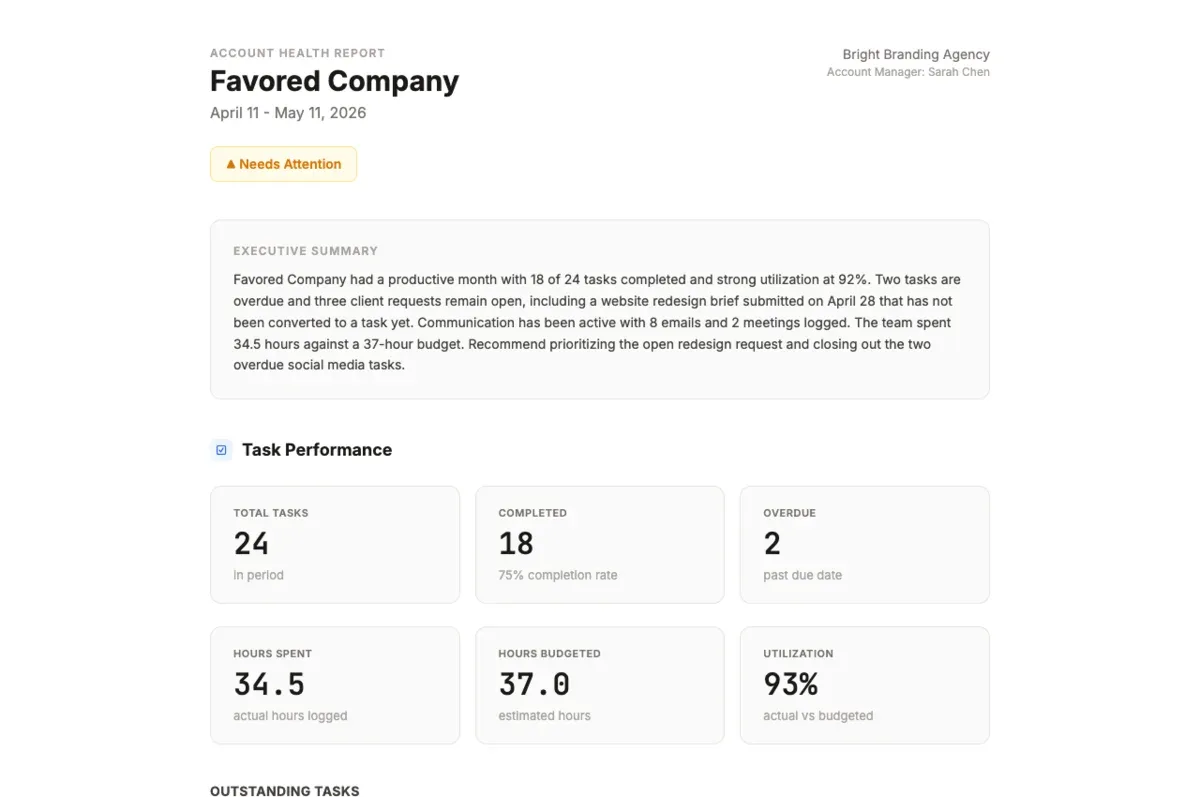
executive_summary | 2-3 sentence overview of account health |
total_tasks | Total number of tasks in the period |
completed_tasks | Number of completed tasks |
overdue_tasks | Number of overdue tasks |
completion_rate | e.g. “75%” |
hours_spent | Total actual hours across completed tasks, e.g. 34.5 |
hours_budgeted | Total budgeted hours across completed tasks, e.g. 37.0 |
utilization_rate | Hours spent divided by hours budgeted, e.g. “93%” |
total_requests, open_requests, closed_requests | Request counts by status |
emails_count, meetings_count, calls_count | Correspondence counts by type |
total_correspondences | Total correspondence count |
List variables require specific field names. The AI builds each list from the tool data:
| Variable | Required fields | Notes |
|---|---|---|
outstanding_tasks | title, assigned_to, due_at, budgeted_hours, overdue, status | assigned_to should be just the person’s name. budgeted_hours should have an “h” suffix like “1.5h”. overdue is true or false. |
completed_task_list | title, assigned_to, completed_at, hours_spent | assigned_to is the person’s name. hours_spent is actual time converted to hours. |
team_members | name, tasks_completed, tasks_in_progress, hours_spent, hours_budgeted | Built by grouping tasks by who they’re assigned to and summing up each person’s counts and hours. |
open_request_list | title, created_by, created_at, details | created_by is the name of whoever submitted the request. Dates formatted like “May 2”. |
recent_correspondence | type, topic, date, participants | participants should be a comma-separated string of just names, not the raw tool output which includes role labels in parentheses. |
flagged_tasks | title, assigned_to, latest_comment | latest_comment is the text of the most recent comment on the task. |
milestones | title, date, completed | completed is true or false. |
key_issues | (string list) | Written by Lifty based on flagged tasks, overdue items, and open requests. |
recommendations | (string list) | Concrete next steps based on the data. |
Customization
Changing the health status thresholds. The AI decides the health status based on the data. If you want consistent rules, add a note to the template description like: “Mark On Track if completion rate is above 80% and no overdue tasks. Needs Attention if overdue tasks exist or completion rate is 50-80%. At Risk if completion rate is below 50% or more than 3 overdue tasks.”
Adding or removing sections. Every section is wrapped in a Liquid conditional ({% if variable %} or {% if list.size > 0 %}). To remove a section, delete its block. To add one, follow the same pattern with a new variable.
Running for a different period. Change the prompt to specify a different date range. The AI will pass the appropriate start_date and end_date to each tool.
Tips
- Test with one client first. Render the report manually before scheduling it. Check that all sections populate and the PDF looks right.
- Time tracking matters. If your team doesn’t log time on tasks, the hours spent, hours budgeted, and utilization sections will show zeros. The rest of the report still works.
- Review the executive summary. The AI writes it based on the data. If the tone doesn’t match, add guidance in the prompt like “Write the executive summary in a professional but direct tone, 2-3 sentences, focusing on completion rate and any blockers.”
- Copy the template across clients. Create it for one client, then use Copy to another client to duplicate it. Each client’s copy renders with their own data.
- Check the participants column. The correspondence tool returns each participant with a role label like “Sarah Chen (account_manager)”. The prompt tells the AI to strip those labels and just list names. If you see the role labels in the rendered report, re-run with the detailed prompt.
Related guides
-
01
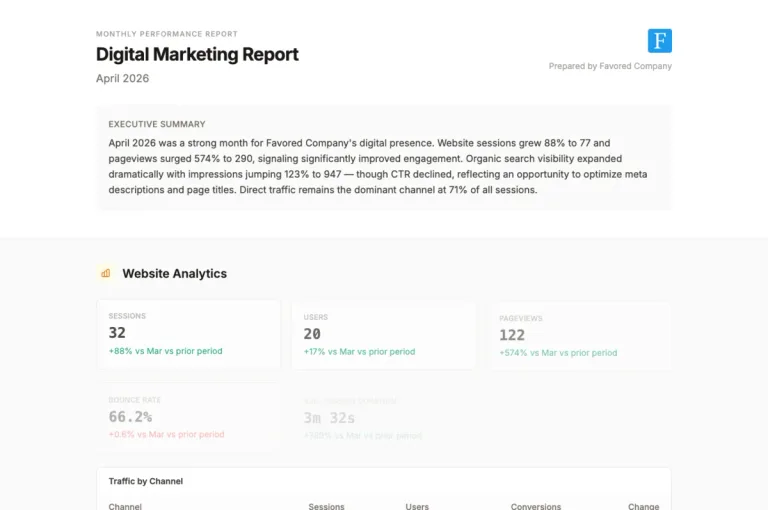
Monthly Performance Report Template with Animated Numbers
A ready-to-use report template covering GA4, Search Console, and Google Business Profile with JavaScript number animations. Copy, paste, and let the AI fill it in.
 02
02
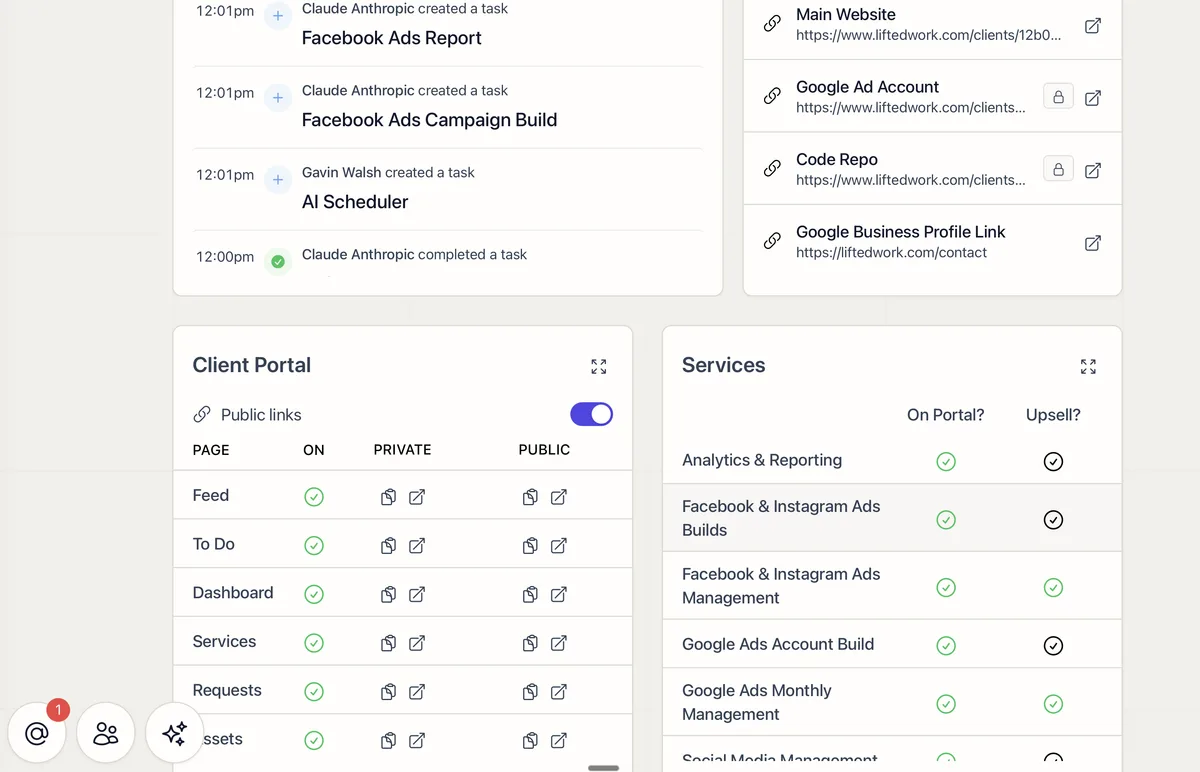
Client Portal: What Your Clients See and How to Set It Up
How the Lifted Work Client Portal works: tabs, requests, deliverables, services, and how to configure it per client.
 03
03
A Practical Guide to Managing Your Agency with Lifted Work
Step-by-step instruction on dashboards, monthly reviews, task creation, client management, and using AI schedulers for scaled agency operations.
 04
04
How to Use the AI Task Scheduler in Lifted Work for Recurring and Onboarding Work
Learn how to automate recurring tasks and client workloads using the AI Task Scheduler. Covers creating scheduling tasks, writing AI prompts, reviewing upcoming work, and tips for staying organized.