Table of contents
Monthly Performance Report Template with Animated Numbers
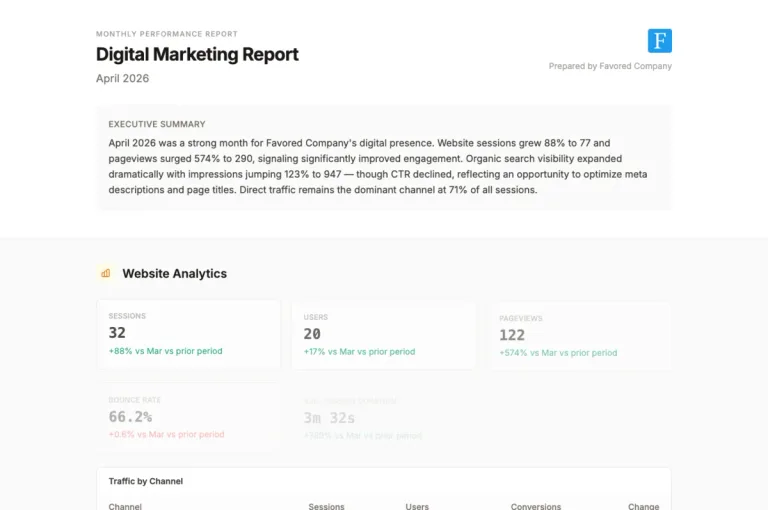
A ready-to-use report template covering GA4, Search Console, and Google Business Profile with JavaScript number animations. Copy, paste, and let the AI fill it in.
What this is
A complete report template you can copy into Lifted Work and use immediately. It covers the three platforms most agencies report on monthly: Google Analytics (GA4), Google Search Console, and Google Business Profile. Numbers animate when they scroll into view. The design uses neutral stone and gray tones that work for any client without clashing with their brand.
The AI calls each platform’s tool, collects the data, and slots it into the template variables. You get a finished PDF or HTML report.
Before you start
Connect the client’s Google accounts so the AI can pull data. Go to Settings > Integrations and connect the Google account that has access to the client’s GA4, Search Console, and/or Google Business Profile. The AI auto-discovers which properties belong to which client based on website URLs and account metadata.
You don’t need all three platforms connected. Each platform section in the template is wrapped in a conditional, so if the AI doesn’t pull data for that platform, the entire section is hidden in the rendered report.
If you’d rather have Lifty build a template for you instead of pasting one in, the report template how-to has a prompt you can use directly. Lifty will look at the client’s actual data, design the template around it, and render the report in one shot. The template below is useful as a starting point you can customize, or as a reference for what a well-structured report template looks like.
Step 1: Create the report template
Go to the client’s overview, open the Report Templates section, and click New.
Head HTML (optional)
This template includes custom fonts and a number animation script. Paste the following into the Head HTML field. If you skip this, the template still works with default fonts and no animations.
<link rel="preconnect" href="https://fonts.googleapis.com">
<link rel="preconnect" href="https://fonts.gstatic.com" crossorigin>
<link href="https://fonts.googleapis.com/css2?family=Inter:wght@400;500;600;700&family=JetBrains+Mono:wght@400;500&display=swap" rel="stylesheet">
<style>
  body { font-family: 'Inter', system-ui, sans-serif; }
  .font-mono { font-family: 'JetBrains Mono', monospace; }

  @keyframes fadeInUp {
    from { opacity: 0; transform: translateY(12px); }
    to { opacity: 1; transform: translateY(0); }
  }
  .animate-in { animation: fadeInUp 0.4s ease-out both; }
  .animate-in:nth-child(2) { animation-delay: 0.05s; }
  .animate-in:nth-child(3) { animation-delay: 0.1s; }
  .animate-in:nth-child(4) { animation-delay: 0.15s; }
  .animate-in:nth-child(5) { animation-delay: 0.2s; }
  .animate-in:nth-child(6) { animation-delay: 0.25s; }

  .stat-number { transition: opacity 0.3s ease; }
</style>
<script>
document.addEventListener('DOMContentLoaded', function() {
  function parseNumber(str) {
    if (!str) return null;
    var clean = str.replace(/[^0-9.\-]/g, '');
    var num = parseFloat(clean);
    return isNaN(num) ? null : num;
  }

  function formatNumber(num, template) {
    var hasPercent = template.indexOf('%') !== -1;
    var hasDollar = template.indexOf('$') !== -1;
    var hasDecimal = template.indexOf('.') !== -1;
    var decimalPlaces = 0;
    if (hasDecimal) {
      var parts = template.replace(/[^0-9.]/g, '').split('.');
      decimalPlaces = parts[1] ? parts[1].length : 0;
    }
    var formatted = hasDecimal ? num.toFixed(decimalPlaces) : Math.round(num).toString();
    if (!hasDecimal && !hasPercent) {
      formatted = Math.round(num).toLocaleString('en-US');
    }
    if (hasDollar) formatted = '$' + formatted;
    if (hasPercent) formatted = formatted + '%';
    return formatted;
  }

  function animateValue(el) {
    var text = el.textContent.trim();
    var target = parseNumber(text);
    if (target === null || target === 0) return;

    var duration = 1200;
    var start = performance.now();
    var from = 0;

    function step(now) {
      var elapsed = now - start;
      var progress = Math.min(elapsed / duration, 1);
      var eased = 1 - Math.pow(1 - progress, 3);
      var current = from + (target - from) * eased;
      el.textContent = formatNumber(current, text);
      if (progress < 1) requestAnimationFrame(step);
    }
    requestAnimationFrame(step);
  }

  var observer = new IntersectionObserver(function(entries) {
    entries.forEach(function(entry) {
      if (entry.isIntersecting) {
        animateValue(entry.target);
        observer.unobserve(entry.target);
      }
    });
  }, { threshold: 0.3 });

  document.querySelectorAll('[data-animate-number]').forEach(function(el) {
    observer.observe(el);
  });
});
</script>
Template HTML
Paste this into the Template HTML field. This is the full report layout with sections for GA4, Search Console, and Google Business Profile.
<div class="bg-stone-50 min-h-screen">
<!-- COVER -->
<header class="bg-white border-b border-stone-200">
<div class="max-w-5xl mx-auto px-8 py-12">
<div class="flex items-start justify-between">
<div>
<p class="text-xs font-medium tracking-widest uppercase text-stone-400 mb-2">Monthly Performance Report</p>
<h1 class="text-3xl font-bold text-stone-900 tracking-tight">{{ report_title | default: "Digital Marketing Report" }}</h1>
<p class="text-stone-500 mt-2 text-lg">{{ report_period | default: current_month }}</p>
</div>
<div class="text-right flex flex-col items-end gap-3">
{% if client_logo != "" %}
<img src="{{ client_logo }}" class="h-10 object-contain" alt="{{ client_name }}">
{% endif %}
<p class="text-sm text-stone-400">Prepared by {{ agency_name }}</p>
</div>
</div>
{% if executive_summary %}
<div class="mt-8 bg-stone-50 rounded-lg p-5 border border-stone-100">
<p class="text-sm font-medium text-stone-500 uppercase tracking-wide mb-2">Executive Summary</p>
<p class="text-stone-700 leading-relaxed">{{ executive_summary }}</p>
</div>
{% endif %}
</div>
</header>
<main class="max-w-5xl mx-auto px-8 py-10 space-y-12">
<!-- GOOGLE ANALYTICS -->
{% if ga4_sessions %}
<section>
<div class="flex items-center gap-3 mb-6">
<div class="w-8 h-8 rounded bg-amber-50 flex items-center justify-center">
<svg class="w-4 h-4 text-amber-600" fill="none" viewBox="0 0 24 24" stroke="currentColor" stroke-width="2"><path d="M9 19v-6a2 2 0 00-2-2H5a2 2 0 00-2 2v6a2 2 0 002 2h2a2 2 0 002-2zm0 0V9a2 2 0 012-2h2a2 2 0 012 2v10m-6 0a2 2 0 002 2h2a2 2 0 002-2m0 0V5a2 2 0 012-2h2a2 2 0 012 2v14a2 2 0 01-2 2h-2a2 2 0 01-2-2z"/></svg>
</div>
<h2 class="text-xl font-semibold text-stone-900">Website Analytics</h2>
</div>
<div class="grid grid-cols-3 gap-4 mb-8">
<div class="bg-white rounded-lg border border-stone-200 p-5 animate-in">
<p class="text-xs font-medium text-stone-400 uppercase tracking-wide">Sessions</p>
<p class="text-2xl font-bold text-stone-900 mt-1 font-mono stat-number" data-animate-number>{{ ga4_sessions }}</p>
{% if ga4_sessions_change %}
<p class="text-sm mt-1 {% if ga4_sessions_trend == "up" %}text-emerald-600{% elsif ga4_sessions_trend == "down" %}text-red-500{% else %}text-stone-400{% endif %}">{{ ga4_sessions_change }} vs prior period</p>
{% endif %}
</div>
<div class="bg-white rounded-lg border border-stone-200 p-5 animate-in">
<p class="text-xs font-medium text-stone-400 uppercase tracking-wide">Users</p>
<p class="text-2xl font-bold text-stone-900 mt-1 font-mono stat-number" data-animate-number>{{ ga4_users }}</p>
{% if ga4_users_change %}
<p class="text-sm mt-1 {% if ga4_users_trend == "up" %}text-emerald-600{% elsif ga4_users_trend == "down" %}text-red-500{% else %}text-stone-400{% endif %}">{{ ga4_users_change }} vs prior period</p>
{% endif %}
</div>
<div class="bg-white rounded-lg border border-stone-200 p-5 animate-in">
<p class="text-xs font-medium text-stone-400 uppercase tracking-wide">Pageviews</p>
<p class="text-2xl font-bold text-stone-900 mt-1 font-mono stat-number" data-animate-number>{{ ga4_pageviews }}</p>
{% if ga4_pageviews_change %}
<p class="text-sm mt-1 {% if ga4_pageviews_trend == "up" %}text-emerald-600{% elsif ga4_pageviews_trend == "down" %}text-red-500{% else %}text-stone-400{% endif %}">{{ ga4_pageviews_change }} vs prior period</p>
{% endif %}
</div>
<div class="bg-white rounded-lg border border-stone-200 p-5 animate-in">
<p class="text-xs font-medium text-stone-400 uppercase tracking-wide">Bounce Rate</p>
<p class="text-2xl font-bold text-stone-900 mt-1 font-mono stat-number" data-animate-number>{{ ga4_bounce_rate }}</p>
{% if ga4_bounce_rate_change %}
<p class="text-sm mt-1 {% if ga4_bounce_rate_trend == "down" %}text-emerald-600{% elsif ga4_bounce_rate_trend == "up" %}text-red-500{% else %}text-stone-400{% endif %}">{{ ga4_bounce_rate_change }} vs prior period</p>
{% endif %}
</div>
<div class="bg-white rounded-lg border border-stone-200 p-5 animate-in">
<p class="text-xs font-medium text-stone-400 uppercase tracking-wide">Avg. Session Duration</p>
<p class="text-2xl font-bold text-stone-900 mt-1 font-mono">{{ ga4_avg_duration }}</p>
{% if ga4_avg_duration_change %}
<p class="text-sm mt-1 {% if ga4_avg_duration_trend == "up" %}text-emerald-600{% elsif ga4_avg_duration_trend == "down" %}text-red-500{% else %}text-stone-400{% endif %}">{{ ga4_avg_duration_change }} vs prior period</p>
{% endif %}
</div>
<div class="bg-white rounded-lg border border-stone-200 p-5 animate-in">
<p class="text-xs font-medium text-stone-400 uppercase tracking-wide">Conversions</p>
<p class="text-2xl font-bold text-stone-900 mt-1 font-mono stat-number" data-animate-number>{{ ga4_conversions }}</p>
{% if ga4_conversions_change %}
<p class="text-sm mt-1 {% if ga4_conversions_trend == "up" %}text-emerald-600{% elsif ga4_conversions_trend == "down" %}text-red-500{% else %}text-stone-400{% endif %}">{{ ga4_conversions_change }} vs prior period</p>
{% endif %}
</div>
</div>
{% if ga4_channels.size > 0 %}
<div class="bg-white rounded-lg border border-stone-200 overflow-hidden mb-6">
<div class="px-5 py-3 border-b border-stone-100">
<h3 class="text-sm font-semibold text-stone-700">Traffic by Channel</h3>
</div>
<table class="w-full text-sm">
<thead>
<tr class="border-b border-stone-100 bg-stone-50/50">
<th class="text-left px-5 py-2.5 font-medium text-stone-500">Channel</th>
<th class="text-right px-5 py-2.5 font-medium text-stone-500">Sessions</th>
<th class="text-right px-5 py-2.5 font-medium text-stone-500">Users</th>
<th class="text-right px-5 py-2.5 font-medium text-stone-500">Conversions</th>
<th class="text-right px-5 py-2.5 font-medium text-stone-500">Change</th>
</tr>
</thead>
<tbody>
{% for channel in ga4_channels %}
<tr class="border-b border-stone-50 hover:bg-stone-50/50">
<td class="px-5 py-2.5 text-stone-800 font-medium">{{ channel.name }}</td>
<td class="px-5 py-2.5 text-right font-mono text-stone-700" data-animate-number>{{ channel.sessions }}</td>
<td class="px-5 py-2.5 text-right font-mono text-stone-700" data-animate-number>{{ channel.users }}</td>
<td class="px-5 py-2.5 text-right font-mono text-stone-700" data-animate-number>{{ channel.conversions }}</td>
<td class="px-5 py-2.5 text-right text-stone-500">{{ channel.change }}</td>
</tr>
{% endfor %}
</tbody>
</table>
</div>
{% endif %}
{% if ga4_top_pages.size > 0 %}
<div class="bg-white rounded-lg border border-stone-200 overflow-hidden">
<div class="px-5 py-3 border-b border-stone-100">
<h3 class="text-sm font-semibold text-stone-700">Top Landing Pages</h3>
</div>
<table class="w-full text-sm">
<thead>
<tr class="border-b border-stone-100 bg-stone-50/50">
<th class="text-left px-5 py-2.5 font-medium text-stone-500">Page</th>
<th class="text-right px-5 py-2.5 font-medium text-stone-500">Sessions</th>
<th class="text-right px-5 py-2.5 font-medium text-stone-500">Users</th>
<th class="text-right px-5 py-2.5 font-medium text-stone-500">Bounce Rate</th>
</tr>
</thead>
<tbody>
{% for page in ga4_top_pages %}
<tr class="border-b border-stone-50 hover:bg-stone-50/50">
<td class="px-5 py-2.5 text-stone-800 font-medium truncate max-w-xs">{{ page.path }}</td>
<td class="px-5 py-2.5 text-right font-mono text-stone-700" data-animate-number>{{ page.sessions }}</td>
<td class="px-5 py-2.5 text-right font-mono text-stone-700" data-animate-number>{{ page.users }}</td>
<td class="px-5 py-2.5 text-right font-mono text-stone-700">{{ page.bounce_rate }}</td>
</tr>
{% endfor %}
</tbody>
</table>
</div>
{% endif %}
</section>
{% endif %}
<!-- GOOGLE SEARCH CONSOLE -->
{% if gsc_clicks %}
<section class="break-before-page">
<div class="flex items-center gap-3 mb-6">
<div class="w-8 h-8 rounded bg-sky-50 flex items-center justify-center">
<svg class="w-4 h-4 text-sky-600" fill="none" viewBox="0 0 24 24" stroke="currentColor" stroke-width="2"><path d="M21 21l-6-6m2-5a7 7 0 11-14 0 7 7 0 0114 0z"/></svg>
</div>
<h2 class="text-xl font-semibold text-stone-900">Organic Search Performance</h2>
</div>
<div class="grid grid-cols-4 gap-4 mb-8">
<div class="bg-white rounded-lg border border-stone-200 p-5 animate-in">
<p class="text-xs font-medium text-stone-400 uppercase tracking-wide">Clicks</p>
<p class="text-2xl font-bold text-stone-900 mt-1 font-mono stat-number" data-animate-number>{{ gsc_clicks }}</p>
{% if gsc_clicks_change %}
<p class="text-sm mt-1 {% if gsc_clicks_trend == "up" %}text-emerald-600{% elsif gsc_clicks_trend == "down" %}text-red-500{% else %}text-stone-400{% endif %}">{{ gsc_clicks_change }} vs prior period</p>
{% endif %}
</div>
<div class="bg-white rounded-lg border border-stone-200 p-5 animate-in">
<p class="text-xs font-medium text-stone-400 uppercase tracking-wide">Impressions</p>
<p class="text-2xl font-bold text-stone-900 mt-1 font-mono stat-number" data-animate-number>{{ gsc_impressions }}</p>
{% if gsc_impressions_change %}
<p class="text-sm mt-1 {% if gsc_impressions_trend == "up" %}text-emerald-600{% elsif gsc_impressions_trend == "down" %}text-red-500{% else %}text-stone-400{% endif %}">{{ gsc_impressions_change }} vs prior period</p>
{% endif %}
</div>
<div class="bg-white rounded-lg border border-stone-200 p-5 animate-in">
<p class="text-xs font-medium text-stone-400 uppercase tracking-wide">Avg. CTR</p>
<p class="text-2xl font-bold text-stone-900 mt-1 font-mono stat-number" data-animate-number>{{ gsc_ctr }}</p>
{% if gsc_ctr_change %}
<p class="text-sm mt-1 {% if gsc_ctr_trend == "up" %}text-emerald-600{% elsif gsc_ctr_trend == "down" %}text-red-500{% else %}text-stone-400{% endif %}">{{ gsc_ctr_change }} vs prior period</p>
{% endif %}
</div>
<div class="bg-white rounded-lg border border-stone-200 p-5 animate-in">
<p class="text-xs font-medium text-stone-400 uppercase tracking-wide">Avg. Position</p>
<p class="text-2xl font-bold text-stone-900 mt-1 font-mono stat-number" data-animate-number>{{ gsc_position }}</p>
{% if gsc_position_change %}
<p class="text-sm mt-1 {% if gsc_position_trend == "down" %}text-emerald-600{% elsif gsc_position_trend == "up" %}text-red-500{% else %}text-stone-400{% endif %}">{{ gsc_position_change }} vs prior period</p>
{% endif %}
</div>
</div>
{% if gsc_top_queries.size > 0 %}
<div class="bg-white rounded-lg border border-stone-200 overflow-hidden mb-6">
<div class="px-5 py-3 border-b border-stone-100">
<h3 class="text-sm font-semibold text-stone-700">Top Search Queries</h3>
</div>
<table class="w-full text-sm">
<thead>
<tr class="border-b border-stone-100 bg-stone-50/50">
<th class="text-left px-5 py-2.5 font-medium text-stone-500">Query</th>
<th class="text-right px-5 py-2.5 font-medium text-stone-500">Clicks</th>
<th class="text-right px-5 py-2.5 font-medium text-stone-500">Impressions</th>
<th class="text-right px-5 py-2.5 font-medium text-stone-500">CTR</th>
<th class="text-right px-5 py-2.5 font-medium text-stone-500">Position</th>
</tr>
</thead>
<tbody>
{% for query in gsc_top_queries %}
<tr class="border-b border-stone-50 hover:bg-stone-50/50">
<td class="px-5 py-2.5 text-stone-800 font-medium">{{ query.query }}</td>
<td class="px-5 py-2.5 text-right font-mono text-stone-700" data-animate-number>{{ query.clicks }}</td>
<td class="px-5 py-2.5 text-right font-mono text-stone-700" data-animate-number>{{ query.impressions }}</td>
<td class="px-5 py-2.5 text-right font-mono text-stone-700">{{ query.ctr }}</td>
<td class="px-5 py-2.5 text-right font-mono text-stone-700">{{ query.position }}</td>
</tr>
{% endfor %}
</tbody>
</table>
</div>
{% endif %}
{% if gsc_top_pages.size > 0 %}
<div class="bg-white rounded-lg border border-stone-200 overflow-hidden">
<div class="px-5 py-3 border-b border-stone-100">
<h3 class="text-sm font-semibold text-stone-700">Top Pages in Search</h3>
</div>
<table class="w-full text-sm">
<thead>
<tr class="border-b border-stone-100 bg-stone-50/50">
<th class="text-left px-5 py-2.5 font-medium text-stone-500">Page</th>
<th class="text-right px-5 py-2.5 font-medium text-stone-500">Clicks</th>
<th class="text-right px-5 py-2.5 font-medium text-stone-500">Impressions</th>
<th class="text-right px-5 py-2.5 font-medium text-stone-500">CTR</th>
</tr>
</thead>
<tbody>
{% for page in gsc_top_pages %}
<tr class="border-b border-stone-50 hover:bg-stone-50/50">
<td class="px-5 py-2.5 text-stone-800 font-medium truncate max-w-xs">{{ page.page }}</td>
<td class="px-5 py-2.5 text-right font-mono text-stone-700" data-animate-number>{{ page.clicks }}</td>
<td class="px-5 py-2.5 text-right font-mono text-stone-700" data-animate-number>{{ page.impressions }}</td>
<td class="px-5 py-2.5 text-right font-mono text-stone-700">{{ page.ctr }}</td>
</tr>
{% endfor %}
</tbody>
</table>
</div>
{% endif %}
</section>
{% endif %}
<!-- GOOGLE BUSINESS PROFILE -->
{% if gbp_total_impressions %}
<section class="break-before-page">
<div class="flex items-center gap-3 mb-6">
<div class="w-8 h-8 rounded bg-emerald-50 flex items-center justify-center">
<svg class="w-4 h-4 text-emerald-600" fill="none" viewBox="0 0 24 24" stroke="currentColor" stroke-width="2"><path d="M17.657 16.657L13.414 20.9a1.998 1.998 0 01-2.827 0l-4.244-4.243a8 8 0 1111.314 0z"/><path d="M15 11a3 3 0 11-6 0 3 3 0 016 0z"/></svg>
</div>
<h2 class="text-xl font-semibold text-stone-900">Google Business Profile</h2>
</div>
<div class="grid grid-cols-3 gap-4 mb-6">
<div class="bg-white rounded-lg border border-stone-200 p-5 animate-in">
<p class="text-xs font-medium text-stone-400 uppercase tracking-wide">Total Impressions</p>
<p class="text-2xl font-bold text-stone-900 mt-1 font-mono stat-number" data-animate-number>{{ gbp_total_impressions }}</p>
{% if gbp_total_impressions_change %}
<p class="text-sm mt-1 {% if gbp_total_impressions_trend == "up" %}text-emerald-600{% elsif gbp_total_impressions_trend == "down" %}text-red-500{% else %}text-stone-400{% endif %}">{{ gbp_total_impressions_change }} vs prior period</p>
{% endif %}
</div>
<div class="bg-white rounded-lg border border-stone-200 p-5 animate-in">
<p class="text-xs font-medium text-stone-400 uppercase tracking-wide">Search Impressions</p>
<p class="text-2xl font-bold text-stone-900 mt-1 font-mono stat-number" data-animate-number>{{ gbp_search_impressions }}</p>
</div>
<div class="bg-white rounded-lg border border-stone-200 p-5 animate-in">
<p class="text-xs font-medium text-stone-400 uppercase tracking-wide">Maps Impressions</p>
<p class="text-2xl font-bold text-stone-900 mt-1 font-mono stat-number" data-animate-number>{{ gbp_maps_impressions }}</p>
</div>
</div>
<div class="grid grid-cols-3 gap-4 mb-8">
<div class="bg-white rounded-lg border border-stone-200 p-5 animate-in">
<p class="text-xs font-medium text-stone-400 uppercase tracking-wide">Phone Calls</p>
<p class="text-2xl font-bold text-stone-900 mt-1 font-mono stat-number" data-animate-number>{{ gbp_call_clicks }}</p>
{% if gbp_call_clicks_change %}
<p class="text-sm mt-1 {% if gbp_call_clicks_trend == "up" %}text-emerald-600{% elsif gbp_call_clicks_trend == "down" %}text-red-500{% else %}text-stone-400{% endif %}">{{ gbp_call_clicks_change }} vs prior period</p>
{% endif %}
</div>
<div class="bg-white rounded-lg border border-stone-200 p-5 animate-in">
<p class="text-xs font-medium text-stone-400 uppercase tracking-wide">Website Clicks</p>
<p class="text-2xl font-bold text-stone-900 mt-1 font-mono stat-number" data-animate-number>{{ gbp_website_clicks }}</p>
{% if gbp_website_clicks_change %}
<p class="text-sm mt-1 {% if gbp_website_clicks_trend == "up" %}text-emerald-600{% elsif gbp_website_clicks_trend == "down" %}text-red-500{% else %}text-stone-400{% endif %}">{{ gbp_website_clicks_change }} vs prior period</p>
{% endif %}
</div>
<div class="bg-white rounded-lg border border-stone-200 p-5 animate-in">
<p class="text-xs font-medium text-stone-400 uppercase tracking-wide">Direction Requests</p>
<p class="text-2xl font-bold text-stone-900 mt-1 font-mono stat-number" data-animate-number>{{ gbp_direction_requests }}</p>
{% if gbp_direction_requests_change %}
<p class="text-sm mt-1 {% if gbp_direction_requests_trend == "up" %}text-emerald-600{% elsif gbp_direction_requests_trend == "down" %}text-red-500{% else %}text-stone-400{% endif %}">{{ gbp_direction_requests_change }} vs prior period</p>
{% endif %}
</div>
</div>
<div class="grid grid-cols-2 gap-6">
<div class="bg-white rounded-lg border border-stone-200 p-5">
<h3 class="text-sm font-semibold text-stone-700 mb-4">Reviews</h3>
<div class="flex items-baseline gap-3 mb-3">
<span class="text-3xl font-bold text-stone-900 font-mono">{{ gbp_avg_rating }}</span>
<span class="text-stone-400 text-sm">/ 5.0 avg rating</span>
</div>
<p class="text-sm text-stone-500 mb-4">{{ gbp_total_reviews }} total reviews</p>
{% if gbp_recent_reviews.size > 0 %}
<div class="space-y-3 border-t border-stone-100 pt-3">
{% for review in gbp_recent_reviews %}
<div class="text-sm">
<div class="flex items-center gap-2 mb-1">
<span class="font-mono text-stone-600">{{ review.rating }}/5</span>
<span class="text-stone-300">·</span>
<span class="text-stone-400">{{ review.date }}</span>
</div>
<p class="text-stone-600 leading-snug">{{ review.comment }}</p>
</div>
{% endfor %}
</div>
{% endif %}
</div>
{% if gbp_top_keywords.size > 0 %}
<div class="bg-white rounded-lg border border-stone-200 overflow-hidden">
<div class="px-5 py-3 border-b border-stone-100">
<h3 class="text-sm font-semibold text-stone-700">Top Search Keywords</h3>
</div>
<table class="w-full text-sm">
<thead>
<tr class="border-b border-stone-100 bg-stone-50/50">
<th class="text-left px-5 py-2.5 font-medium text-stone-500">Keyword</th>
<th class="text-right px-5 py-2.5 font-medium text-stone-500">Impressions</th>
</tr>
</thead>
<tbody>
{% for kw in gbp_top_keywords %}
<tr class="border-b border-stone-50">
<td class="px-5 py-2.5 text-stone-800">{{ kw.keyword }}</td>
<td class="px-5 py-2.5 text-right font-mono text-stone-700" data-animate-number>{{ kw.impressions }}</td>
</tr>
{% endfor %}
</tbody>
</table>
</div>
{% endif %}
</div>
</section>
{% endif %}
<!-- KEY TAKEAWAYS & NEXT STEPS -->
{% if key_takeaways.size > 0 or next_steps.size > 0 %}
<section class="break-before-page">
<div class="flex items-center gap-3 mb-6">
<div class="w-8 h-8 rounded bg-stone-100 flex items-center justify-center">
<svg class="w-4 h-4 text-stone-600" fill="none" viewBox="0 0 24 24" stroke="currentColor" stroke-width="2"><path d="M9 5H7a2 2 0 00-2 2v12a2 2 0 002 2h10a2 2 0 002-2V7a2 2 0 00-2-2h-2M9 5a2 2 0 002 2h2a2 2 0 002-2M9 5a2 2 0 012-2h2a2 2 0 012 2m-6 9l2 2 4-4"/></svg>
</div>
<h2 class="text-xl font-semibold text-stone-900">Insights & Next Steps</h2>
</div>
<div class="grid grid-cols-2 gap-6">
{% if key_takeaways.size > 0 %}
<div class="bg-white rounded-lg border border-stone-200 p-5">
<h3 class="text-sm font-semibold text-stone-700 mb-3">Key Takeaways</h3>
<ul class="space-y-2">
{% for item in key_takeaways %}
<li class="flex items-start gap-2 text-sm">
<span class="text-stone-300 mt-0.5 shrink-0">—</span>
<span class="text-stone-700 leading-relaxed">{{ item }}</span>
</li>
{% endfor %}
</ul>
</div>
{% endif %}
{% if next_steps.size > 0 %}
<div class="bg-white rounded-lg border border-stone-200 p-5">
<h3 class="text-sm font-semibold text-stone-700 mb-3">Recommended Next Steps</h3>
<ol class="space-y-2 list-decimal list-inside">
{% for step in next_steps %}
<li class="text-sm text-stone-700 leading-relaxed">{{ step }}</li>
{% endfor %}
</ol>
</div>
{% endif %}
</div>
</section>
{% endif %}
</main>
<footer class="border-t border-stone-200 bg-white mt-12">
<div class="max-w-5xl mx-auto px-8 py-6 flex justify-between items-center">
<p class="text-xs text-stone-400">{{ agency_name }} · {{ current_date }}</p>
<p class="text-xs text-stone-400">Confidential — Prepared for {{ client_name }}</p>
</div>
</footer>
</div>Step 2: Set the template name and defaults
Give the template a name like “Monthly Performance Report” and set the default output to PDF. You can leave the slug prefix blank. The system generates one automatically.
How the variables work
The template uses Liquid syntax. Variables wrapped in {{ }} get replaced with real values when the report is rendered. Variables inside {% if %} blocks are conditional. If the AI doesn’t provide that variable, the section is hidden.
There are two types of variables:
System variables are filled in automatically. You never need to provide these:
client_nameandclient_logo(from the client record)agency_name(from your agency record)current_dateandcurrent_month(set at render time)
Custom variables are provided by the AI when it renders the report. The AI calls the Google tools, collects the data, and passes it in. Here’s what each variable expects:
| Variable | What the AI fills in |
|---|---|
report_title | e.g. “March 2026 Performance Report” |
report_period | e.g. “March 1-31, 2026” |
executive_summary | 2-3 sentence overview of the month |
ga4_sessions, ga4_users, ga4_pageviews | Formatted numbers from GA4 summary |
ga4_bounce_rate | e.g. “42.5%” |
ga4_avg_duration | e.g. “2m 34s” |
ga4_conversions | Total conversions for the period |
ga4_*_change | e.g. “+12.3%”, the month-over-month delta |
ga4_*_trend | “up”, “down”, or “flat” (controls the color) |
ga4_channels | List of channels with name, sessions, users, conversions, change |
ga4_top_pages | List of pages with path, sessions, users, bounce_rate |
gsc_clicks, gsc_impressions, gsc_ctr, gsc_position | Search Console summary metrics |
gsc_top_queries | List with query, clicks, impressions, ctr, position |
gsc_top_pages | List with page, clicks, impressions, ctr |
gbp_total_impressions, gbp_search_impressions, gbp_maps_impressions | GBP visibility metrics |
gbp_call_clicks, gbp_website_clicks, gbp_direction_requests | GBP action metrics |
gbp_avg_rating, gbp_total_reviews | Review summary |
gbp_recent_reviews | List with rating, date, comment |
gbp_top_keywords | List with keyword, impressions |
key_takeaways | List of strings, the AI’s analysis of the data |
next_steps | List of strings, specific recommendations |
The _trend variables deserve a note. They control whether the change text shows in green or red. For most metrics, “up” is good and “down” is bad. But for bounce rate and search position, lower is better. The AI handles this inversion automatically.
Step 3: Render the report
You can render the report two ways.
Manually via the AI chat: Open a task for the client, open the AI chat sidebar, and tell Lifty:
Pull last month’s data from all connected Google platforms and generate the Monthly Performance Report with all the variables filled in.
Lifty reads the template, sees which variables it needs, pulls the data, and renders the report. If you want more control, you can be more specific:
Pull GA4 summary and channel data for this client for the past month, comparing to the previous month. Use the lead_gen kpi profile. Also pull Search Console summary, top queries, and top pages. Also pull Google Business Profile summary, reviews, and search keywords. Then render the “Monthly Performance Report” template as a PDF, using the variable names from the template (ga4_sessions, ga4_users, ga4_channels, gsc_clicks, gsc_top_queries, gbp_total_impressions, gbp_recent_reviews, etc). Set the _trend variables to “up” or “down” based on whether the change is positive or negative. For bounce rate and search position, invert the trend since lower is better. Write an executive_summary, key_takeaways, and next_steps based on the data.
Automatically via a scheduled task: Create a task template with the prompt above, set it as the Lifty Prompt with Run on complete enabled, turn on Autocomplete, and schedule it for the last business day of each month. See the AI Task Scheduling guide for the full setup.
Under Tools for AI on the task, select: ga4_report, gsc_search_analytics, gbp_report, report_templates, reports.
How the number animations work
Every number with a data-animate-number attribute in the template counts up from zero to its final value when it scrolls into view. The animation uses an ease-out curve over 1.2 seconds: fast at the start, decelerating at the end.
The JavaScript handles formatting automatically. If the number has a % sign, commas, a $ prefix, or decimal places, the animation preserves that formatting throughout the count. A number like “12,450” will animate as “0”, “1,245”, “6,225”, “12,450” with proper comma separation at every frame.
The animation only fires once per element. If someone scrolls past and comes back, the number stays at its final value. In PDF output, the renderer scrolls the page before capture to trigger scroll-based animations, so the numbers appear at their final values in the PDF automatically. No special handling is needed for PDF.
Extending the template
Adding Meta Ads
If you run Facebook or Instagram ads for a client, you can add a paid social section. The AI has a meta_ads_report tool that returns spend, impressions, clicks, CTR, CPC, conversions, and cost per conversion.
Open the AI chat on a task for that client and tell Lifty:
Add a Meta Ads section to this report template between the Search Console and Google Business Profile sections. Include KPI cards for spend, impressions, clicks, CTR, conversions, and cost per conversion with month-over-month changes. Add a campaign breakdown table. Use the same neutral styling as the other sections. Use a purple-50 icon background to differentiate it.
Then update your rendering prompt to add “Meta Ads summary and campaign breakdown” to the data collection step, and add meta_ads_report to Tools for AI on the task.
Adding Google Ads
Same approach. The google_ads_report tool returns spend, clicks, impressions, CTR, conversions, cost per conversion, and campaign-level breakdowns.
Add a Google Ads section to this report template. Include KPI cards for spend, clicks, conversions, CPA, and CTR. Add a campaign breakdown table showing each campaign’s spend, conversions, and CPA. Use a blue-50 icon background.
Customizing with Claude
If you want to redesign sections or change the layout, you can paste the template into Claude (claude.ai) and ask it to modify specific parts. The template is standard HTML with Tailwind classes, so any AI that knows Tailwind can edit it. Paste the result back into the Template HTML field.
Some ideas:
- “Make the KPI cards 2 columns instead of 3 for a narrower layout”
- “Add a horizontal bar chart using CSS for the channel breakdown instead of a table”
-
“Add a section for completed tasks this month with a list variable called
completed_tasks“ - “Change the color scheme from stone to slate”
After editing, save the template and render a test report to check the output.
Removing sections
If a client doesn’t use one of the platforms, you don’t need to edit the template. Each platform section is wrapped in a {% if %} conditional. If the AI doesn’t provide those variables, the section won’t appear. But if you want a cleaner template that only covers what you need, you can delete the HTML for any section you don’t use.
Tips
- Test with one client first. Render the report manually before scheduling it. Check that all three platforms return data and that the formatting looks right in the PDF.
- The comparison period matters. The default prompt says “comparing to the previous month.” For seasonal businesses, change this to “comparing to the same month last year.”
- E-commerce clients need a different KPI profile. Change
lead_gentoecomin the prompt. This gives you revenue and purchase metrics instead of conversions. - Review the executive summary. The AI writes it based on the data it pulled. If the tone doesn’t match what you’d send to clients, add guidance in the prompt like “Write the executive summary in a professional but direct tone, 2-3 sentences, focusing on the most significant change this month.”
- Copy the template across clients. Create it for one client, then use Copy to another client to duplicate it. Each client’s copy renders with their own data.
Related guides
-
01
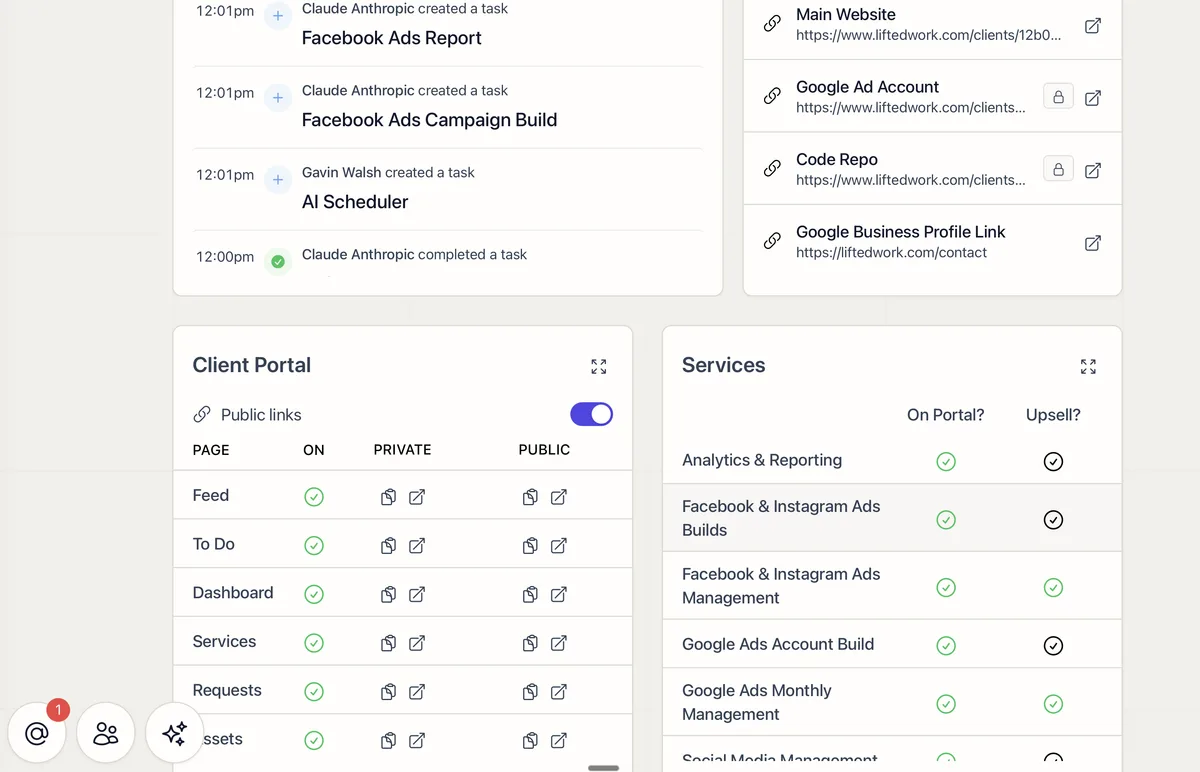
Client Portal: What Your Clients See and How to Set It Up
How the Lifted Work Client Portal works: tabs, requests, deliverables, services, and how to configure it per client.
 02
02
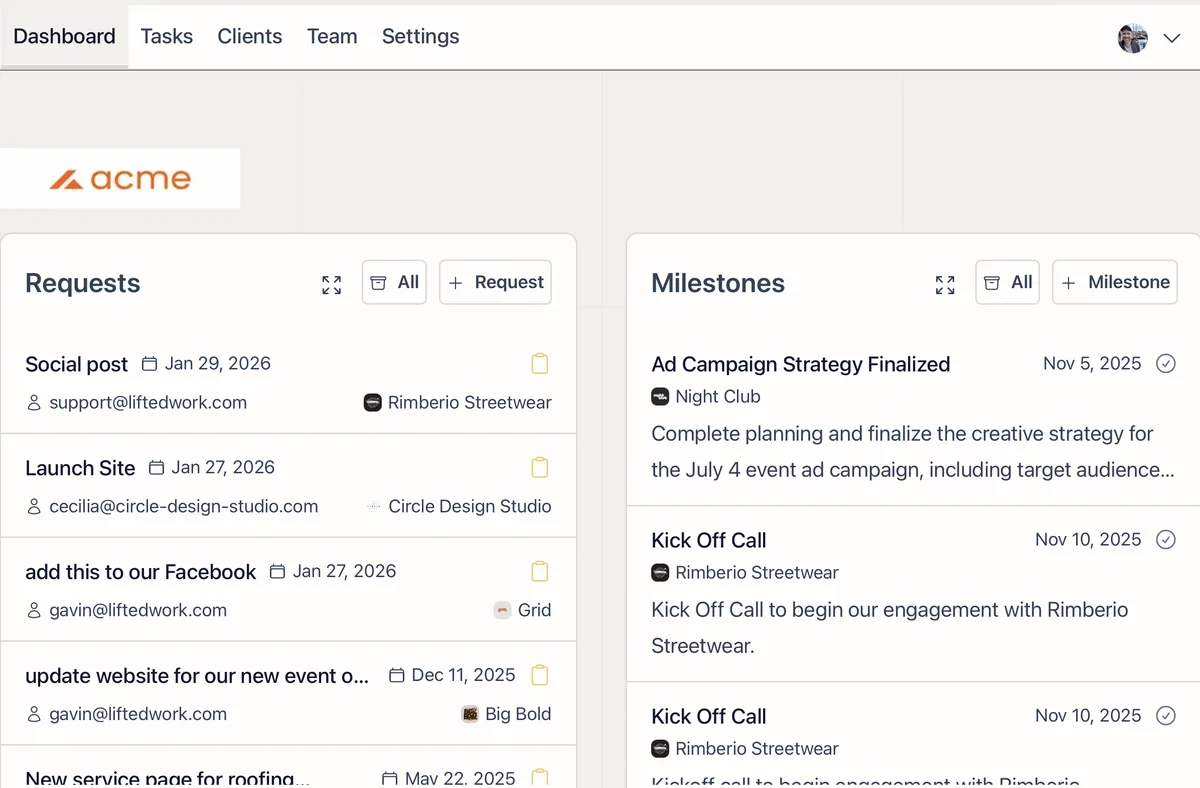
A Practical Guide to Managing Your Agency with Lifted Work
Step-by-step instruction on dashboards, monthly reviews, task creation, client management, and using AI schedulers for scaled agency operations.
 03
03
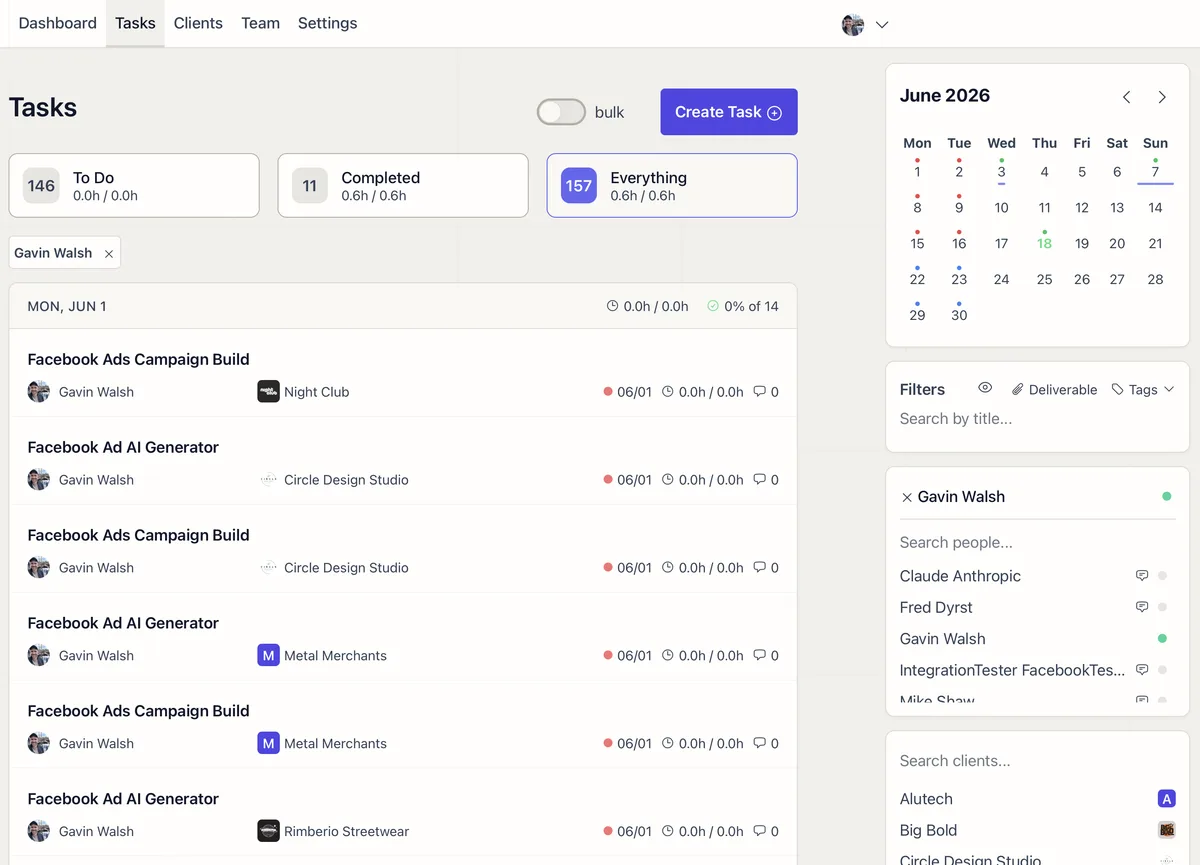
How to Use the AI Task Scheduler in Lifted Work for Recurring and Onboarding Work
Learn how to automate recurring tasks and client workloads using the AI Task Scheduler. Covers creating scheduling tasks, writing AI prompts, reviewing upcoming work, and tips for staying organized.
 04
04
How AI Builds on Its Own Work: Chaining Deliverables Across Tasks
Sequence AI tasks so each one builds on the last. A draft created in one task carries to the next, where AI revises it, adds images, or reviews it before a client ever sees it.