How to Create a Report Template
Three ways to create report templates: ask Lifty AI, paste HTML from a guide, or generate one with Claude or ChatGPT. Plus how to copy templates between clients.
1 What Is a Report Template?
A report template is an HTML layout with placeholder variables that the AI fills in when rendering a report. Templates belong to a specific client. When the AI renders the template, it replaces variables like {{ ga4_sessions }} or {{ executive_summary }} with real data and produces a PDF or HTML report. Tailwind CSS is loaded automatically, so you style everything with standard Tailwind classes.
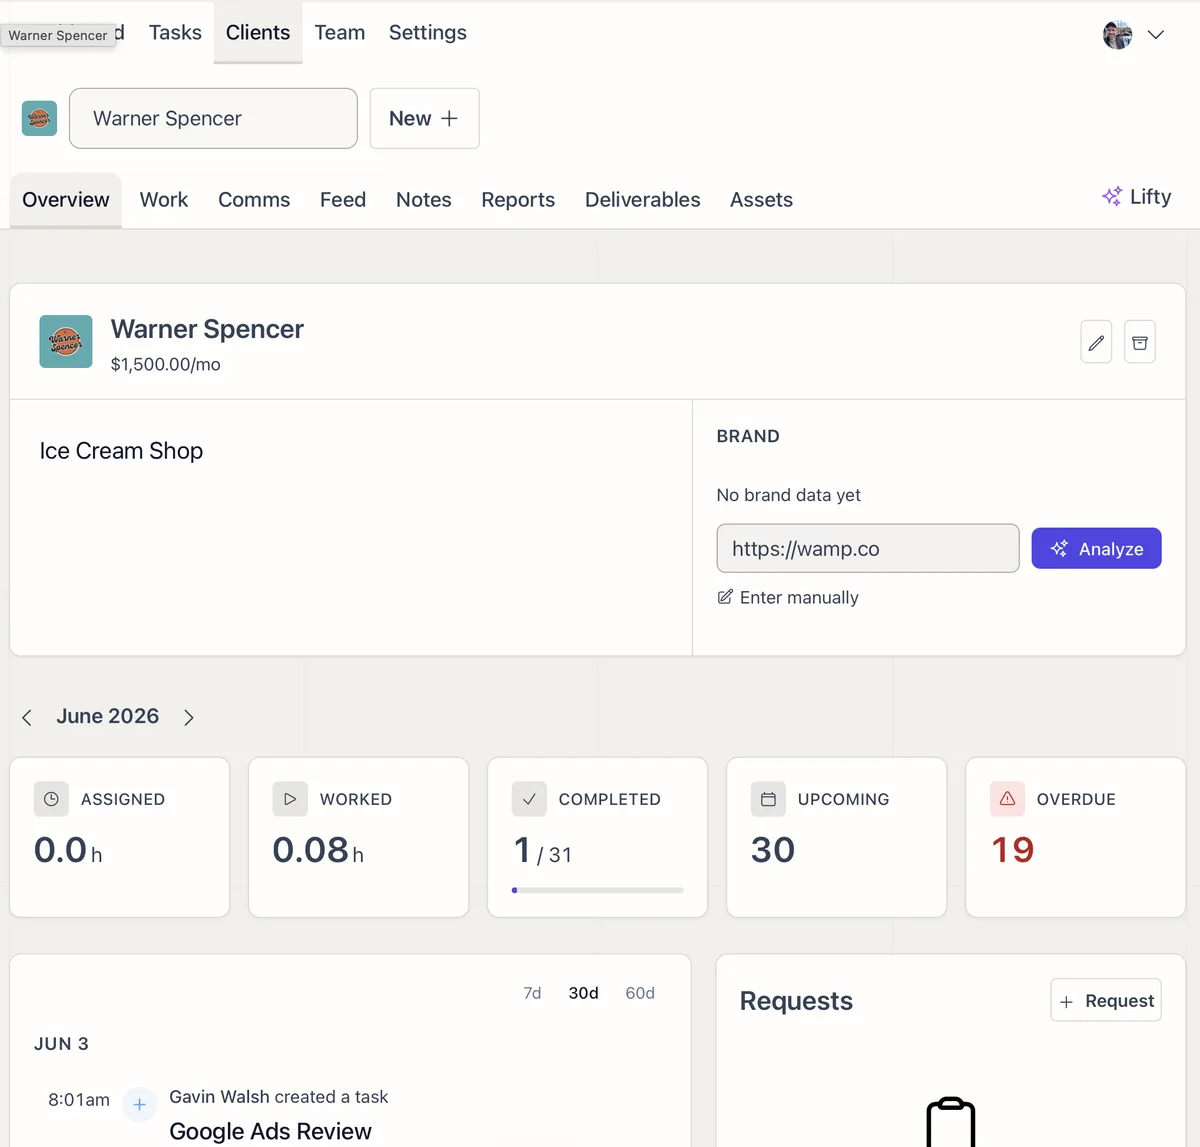
You can find report templates on the client’s overview page under Report Templates.
2 Option 1: Ask Lifty AI to Create One
Open Lifty from the AI icon in the bottom-left corner, or open the AI chat sidebar on any task for the client. Mention the client with @ so Lifty knows where to create the template.
The simplest approach is to tell Lifty what data source to build the report around and let it handle the rest:
Please create a new Google Search Console report template for @ClientName.
Look up the client’s Google Search Console data and select the most relevant metrics to include in the report.
Design the report to be clean and visually appealing, with some animation on the numbers if you think it adds value.
Build the template around the expected data and the variables we want to pull, so the report returns the information we need.
Run the report using the template.
Lifty pulls the actual data first, designs the template around what’s available, renders the report, and saves everything to the client. You get a finished report and a reusable template in one shot. This works for any data source: swap “Google Search Console” for “GA4,” “Google Business Profile,” “Google Ads,” or ask for a combined report across multiple platforms.
If you want more control over the exact layout, you can specify the sections and variables yourself:
Create a report template for @ClientName called “Monthly Performance Report”. It should have sections for:
- A header with the report title, client logo, and reporting period
- An executive summary section
- Website analytics: sessions, users, pageviews, bounce rate, avg session duration, and conversions as KPI cards, plus a channel breakdown table and top landing pages table
- Search performance: clicks, impressions, CTR, and avg position as KPI cards, plus top search queries and top pages tables
- Google Business Profile: total impressions split by search and maps, phone calls, website clicks, direction requests, a reviews summary with rating and recent reviews, and top search keywords
- Key takeaways and recommended next steps at the bottom
- A footer with the agency name and date
Use neutral colors (stone/gray tones) so it works for any client. Use Tailwind classes. Make the KPI cards show a change percentage with green for positive and red for negative trends. Use variables prefixed with ga4, gsc, and gbp_ so they map to the analytics tools. Add JavaScript that animates numbers from zero to their final value when they scroll into view.
Both approaches save the template to the client’s overview under Report Templates. Open it from there to review the HTML or make adjustments.
3 Option 2: Copy and Paste from the Guide
The Monthly Performance Report Template guide has a complete template ready to copy.
- Go to the client’s overview page
- Under Report Templates, click New
- Name it “Monthly Performance Report”
- Copy the Template HTML from the guide and paste it into the Template HTML field
- Copy the Head HTML from the guide and paste it into the Head HTML field (this contains the fonts and number animation script)
- Click Create Template
The template includes GA4, Search Console, and Google Business Profile sections with animated numbers, month-over-month change indicators, and a neutral color scheme.
4 Option 3: Generate One with Claude or ChatGPT
If you want a custom layout, you can ask any AI to generate the HTML and then paste it in. Here’s a prompt that works with Claude or ChatGPT:
I need an HTML report template for a marketing agency’s monthly client report. Requirements:
- Use Tailwind CSS classes (the Tailwind CDN is already loaded, don’t include it)
- Use Liquid template syntax for variables: {{ variable_name }} for output, {% if variable %} for conditionals, {% for item in list %} for loops
- System variables that are auto-filled: {{ client_name }}, {{ client_logo }}, {{ agency_name }}, {{ current_date }}, {{ current_month }}
- Use standard Tailwind color classes (bg-slate-600, text-stone-900, etc.)
- Include any Google Fonts links or style blocks directly in the HTML
Include these sections with the following variable names:
GA4 section (wrap in {% if ga4_sessions %}):
- KPI cards: ga4_sessions, ga4_users, ga4_pageviews, ga4_bounce_rate, ga4_avg_duration, ga4_conversions
- Each KPI has a _change variable (e.g. “+12%”) and a _trend variable (“up”, “down”, or “flat”) that controls the text color
- ga4_channels list with fields: name, sessions, users, conversions, change
- ga4_top_pages list with fields: path, sessions, users, bounce_rate
Search Console section (wrap in {% if gsc_clicks %}):
- KPI cards: gsc_clicks, gsc_impressions, gsc_ctr, gsc_position
- Each has _change and _trend variables
- gsc_top_queries list with fields: query, clicks, impressions, ctr, position
- gsc_top_pages list with fields: page, clicks, impressions, ctr
Google Business Profile section (wrap in {% if gbp_total_impressions %}):
- KPI cards: gbp_total_impressions, gbp_search_impressions, gbp_maps_impressions, gbp_call_clicks, gbp_website_clicks, gbp_direction_requests
- gbp_avg_rating, gbp_total_reviews
- gbp_recent_reviews list with fields: rating, date, comment
- gbp_top_keywords list with fields: keyword, impressions
Also include: report_title, report_period, executive_summary, key_takeaways (list of strings), next_steps (list of strings)
For bounce rate and search position, “down” should show green since lower is better.
Output as a single HTML block I can paste directly into a template.
Copy the output, go to the client’s overview, create a new report template, and paste it into the Template HTML field.
5 Copying a Template to Another Client
Once you have a template working for one client, you can copy it to any other client:
- Go to the client’s overview page
- Open the template you want to copy
- Click Copy to another client
- Select the target client from the dropdown
- Click Copy
The new template gets the same name, HTML, and settings. Each client’s copy uses their own system variables (client name, logo, agency name) at render time.
6 Copying the HTML Manually
If you want to paste a template’s HTML into another tool or share it:
- Open the template from the client’s overview
- Click the Copy button next to the Template HTML
- The HTML is copied to your clipboard
This is useful if you want to edit the HTML in an external editor before pasting it into a new template.
7 Tips
- Start with one client. Get the template right, render a test report, then copy it to your other clients.
- The AI chat sidebar on a task works too. If you’re already working on a task for a client, you can create templates from there without needing to @mention the client.
- Templates auto-detect variables. When you save a template, the system extracts all Liquid variables and shows them in the Variables section. System variables (client_name, agency_name, etc.) are marked as auto-filled. Custom variables need to be provided when rendering.
- Animations work in both HTML and PDF. Number counters, progress bars, fade-ins, and other animations display their final values in the PDF. The PDF renderer scrolls the page before capture, so scroll-triggered animations fire normally. No special handling needed.
- Test with a manual render. After creating a template, open the AI chat and ask Lifty to render it with sample data before scheduling it for automated monthly reports.
- Automate it. Once the template is working, use the Monthly Reporting AI Playbook to pull analytics data and render the report automatically each month.
Related how-tos
-
01
How to Connect Claude or ChatGPT to Lifted Work
Step-by-step setup for connecting Claude, ChatGPT, or any MCP client to Lifted Work so your AI can manage tasks, emails, and clients.
 02
02
How to Create a Task in Lifted Work
A complete walkthrough of every task option: title, assignment, due date, time estimate, AI instructions, autocomplete, after-completion prompts, tags, and visibility.
 03
03
How to Use the Lifty AI Sidebar
Lifty is a built-in chat assistant for agency admins and managers. Create tasks, generate milestones, draft emails, and pull analytics from a single sidebar.
 04
04
Onboard New Clients in Under 15 Minutes
A step-by-step process for setting up new clients in Lifted Work, from creating the client to previewing their portal.